 |
|
|
 |
|
|
|
|
|
This webpage describes the IRAC 3.6-micron-selected catalog of the Extended Groth Strip (EGS), released 2008 February. (There was also an earlier release made as part of the August 2007 general EGS data release by the AEGIS collaboration; this catalog supersedes the earlier version). A more detailed description of the data and catalog are in this paper. The data and catalog are provided for use by any interested party; please acknowledge the catalog paper (Barmby et al. 2008 ApJS, in press) in any published work. For more information about this webpage or the catalogs, contact Pauline Barmby: pbarmby AT uwo DOT ca.
Click here to go directly to the download area.
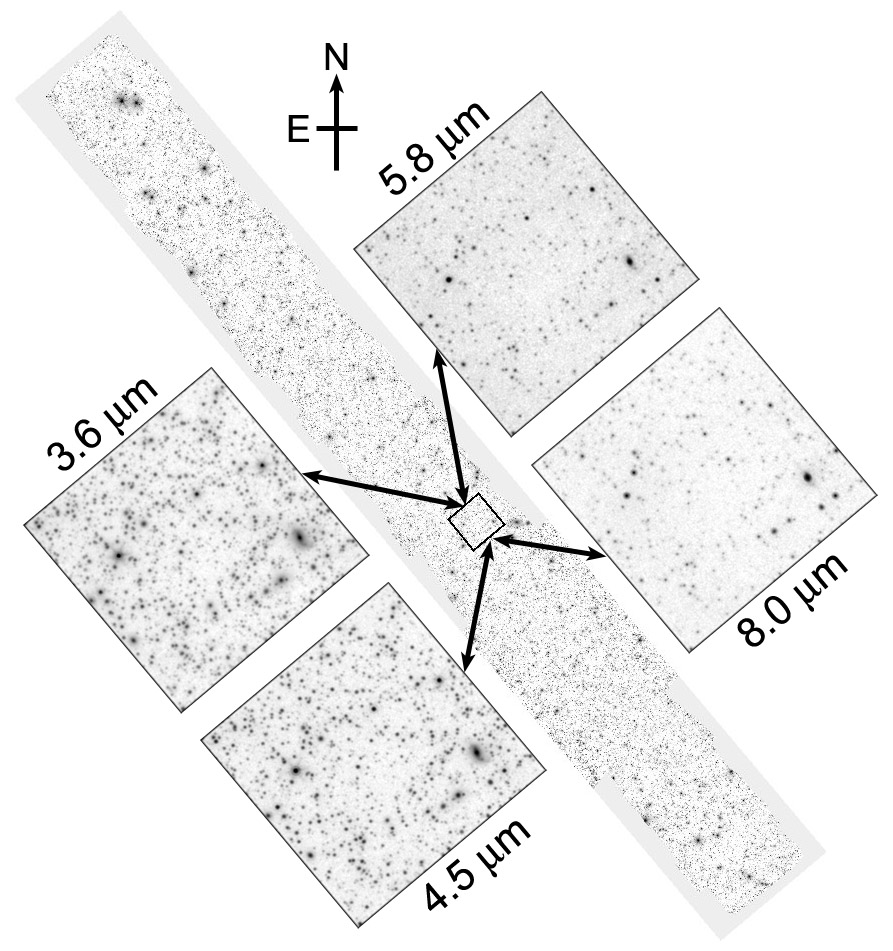
The figure below illustrates the layout of the strip on the sky.
Insets show 5x5 arcmin cutouts in each of the four bands.
The mosaics used to make the catalog began with Basic Calibrated Data (BCDs) processed by the S14 version of the SSC pipeline. No additional processing was performed before mosaicing. Mosaicing was done using custom IDL scripts based on the IDL Astronomy User's Library. Each individual frame was projected onto a reference frame which included all the input images, then the frames were combined by averaging-plus-3sigma-clipping. Rejection of cosmic rays, scattered light, muxbleed, and other image artifacts was accomplished by the sigma-clipping during mosaicing. Some artifacts remained in the final mosaics and artifact maps were generated to mark these. Exposure maps showing the number of frames combined at each location were also generated during mosaicing. (Note that the exposure maps for channel 4 show four times as many frames, because four shorter frames are taken at each dither position.) A minimum coverage and artifact map was created by combining the coverage maps in the 4 bands plus the 3.6um artifact map with a minimum function.
The co-added mosaics were re-projected with SWarp to put all four IRAC bands on the same coordinate grid and pixel scale. The mosaic pixel scale is 0.61", sub-sampling the native IRAC pixel scale by about a factor of two. The astrometry is based on the input BCDs, which are tied to the 2MASS frame. Comparison with the DEEP2 photometric catalog shows excellent agreement with its coordinate system, except at the ends of the EGS where a small correction to the IRAC coordinates is required (see catalog paper for details). The mosaic images are in units of surface brightness (MJy/sr). The conversion from image counts to flux densities in microJanskys is f[microJy] = 8.7459*(counts); to convert from image counts to AB magnitudes, use AB = 21.545 - 2.5*log(counts).
The averaged mosaics were used for all catalog production and photometry. Object-finding was done using SExtractor, with parameters of DETECT_MINAREA = 5, DETECT_THRESH=1.5 (3.6/4.5) or 3.0 (5.8/8.0), DEBLEND_MINCONT = 0 (3.6/4.5), 0.005 (5.8/8.0). A catalog was created first from the 3.6um image, then sources were detected on the other images and matched to 3.6um sources with SExtractor's ASSOC mechanism. In the area with good coverage and no artifacts (1362 square arcmin), the raw catalogs contain (57.4, 48.0, 16.3, 13.6)*1E3 objects in the 4 IRAC bands.
The catalog contains SExtractor's AUTO and ISOCOR magnitudes as well as aperture photometry in 2.5, 3.5, and 5-pixel radius apertures. Aperture corrections derived from averaged `mosaic PSFs' were applied to the aperture magnitudes but not to AUTO or ISOCOR measurements. A few large, extended objects also had all of their magnitudes corrected by the extended source calibration derived by the SSC (see paper for a list of corrections). Photometric errors are those reported by SExtractor, with a correction to account for correlated background noise. The absolute photometric accuracy depends on the absolute calibration of IRAC, believed to be good to 3%. Please see the paper for details of completeness, reliability, confusion, etc.
The columns of the final, full catalog are listed below. Column names ending in _i are repeated 4 times, once for each IRAC band (i=1,2,3,4 for 3.6, 4.5, 5.8, 8.0 microns).| Name | units | Description |
| ID | Object ID in format EGSIRAC Jhhmmss.ss+ddmmss.s | |
| ALPHAWIN_J2000 | deg | RA (J2000, decimal), measured at 3.6um |
| DELTAWIN_J2000 | deg | Dec (J2000, decimal), measured at 3.6um |
| CLASS_STAR | Stellarity index, measured at 3.6um | |
| FLAGS | SExtractor flags for 3.6um source | |
| COVERAGE | Minimum coverage at object position | |
| XWIN_IMAGE_i | pixel | Image position |
| YWIN_IMAGE_i | pixel | Image position |
| ISOAREA_IMAGE_i | pixel^2 | isophotal area |
| KRON_RADIUS_i | pixel | Kron radius |
| AWIN_IMAGE_i | pixel | Object semi-major axis |
| BWIN_IMAGE_i | pixel | Object semi-minor axis |
| THETAWIN_J2000_i | degrees | position angle, east of north |
| MAG_AUTO_i | AB mag | Kron magnitude |
| MAGERR_AUTO_i | AB mag | Kron magnitude uncertainty |
| MAG_ISOCOR_i | AB mag | isophotal magnitude |
| MAGERR_ISOCOR_i | AB mag | isophotal magnitude uncertainty |
| MAG_APER_i | AB mag | aperture magnitudes in 2.5, 3.5, and 5-pixel radii |
| MAGERR_APER_i | AB mag | aperture magnitude uncertainties |
In the earlier release, we produced a `simple' catalog, containing only positions and one aperture magnitude (2.5-pixel radius) per object. This was primarily for use in the AEGIS collaboration multi-wavelength SED project.