| Spectra and Maps Available
|
From Anja Visser's PhD Thesis
From Reference:
"Dense Cores in Dark Clouds. XIV. N2H+ (1-0) maps of Dense Cloud Cores"
by Paola Caselli,
Priscilla J. Benson, Philip C. Myers, and Mario Tafalla
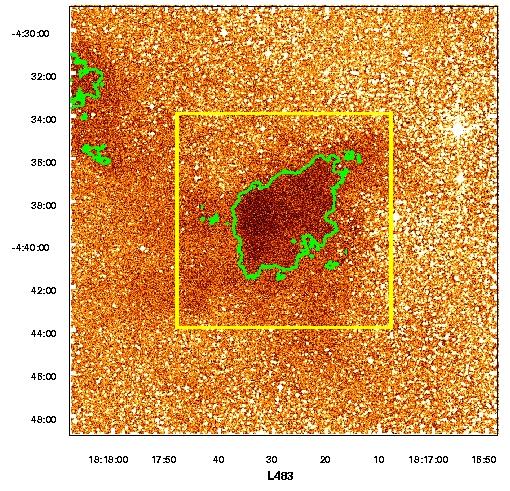
Maps of the N2H+ (1-0) intensity integrated over the seven hyperfine components. The contours and the gray scale represent 20%, 35%, 50%, 35%, 85%, and 90% of the map peak. The thick contour is the half-maximum (50%) level, which defines the core size. The stars indicate the location of the associated infrared source detected by IRAS.
N2H+ (1-0) integrated intensity maps of those cores where "local" velocity gradients have been calculated. The gray-scale levels represent 30%, 50%, 70%, and 90% of the map peak. Small dots mark the position of observed spectra where the determination of V LSR from the hfs fit has been possible. The thin arrows show the magnitude and the direction of the velocity gradient calculated by applying the least-squares fitting routine to the grid of positions centered on the corresponding arrow. The thick arrow in the bottom of the panel represents the total velocity gradient.
Map of line width (gray scale) overlapped with integrated intensity map (contours; levels are 30%, 50%, 70%, and 90% of the peak). Gray contours range from  vmin to vmin to  vmax in steps of 2 vmax in steps of 2  where is the mean line width error in the selected positions. Gray areas enclose all the points with v values between two adjacent gray contours. The dots mark the positions that have been used in the v maps (i.e., where v/ where is the mean line width error in the selected positions. Gray areas enclose all the points with v values between two adjacent gray contours. The dots mark the positions that have been used in the v maps (i.e., where v/ v v  3 and I/I 5). Values of vmin, vmax, and 2 (in units of km s-1) in L483 are as follows: 0.24, 0.85, and 0.11 3 and I/I 5). Values of vmin, vmax, and 2 (in units of km s-1) in L483 are as follows: 0.24, 0.85, and 0.11
From Reference:
"Tracing the Mass During Low-Mass Star Formation. I. Submillimeter continuum observations.
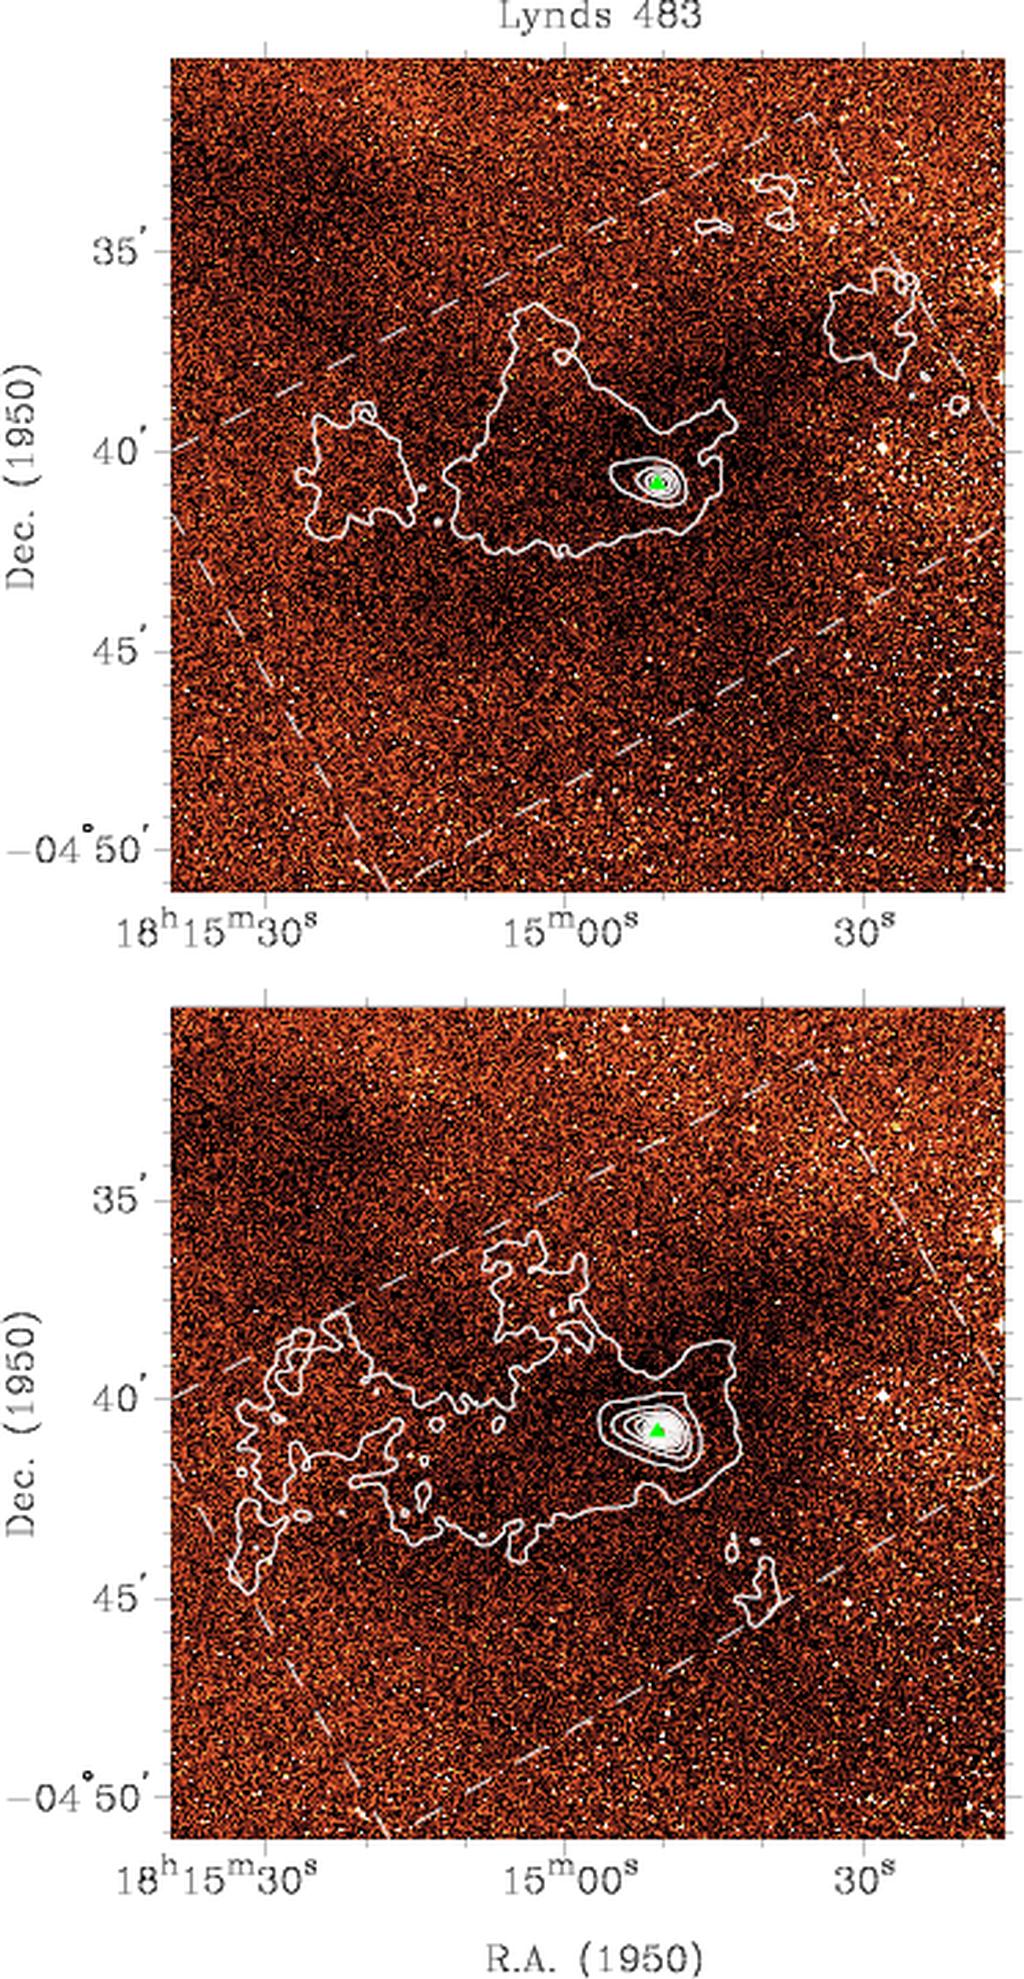
Contour maps of Class 0 sources at 850  m, and at 450 m. The solid line indicates the outflow direction. The contour levels are as follows (lowest contour and contour increment in percentage of the peak flux). L1527 (850 m) 10% (4 ) increasing by 10%. L1527 (450 m) 5% (5 ), 10% (8 ) increasing by 10%. B228 (850 m) 5% (4 ), 10% (8 ) increasing by 10%. B228 (450 m) 5% (3 ), 10% (6 ) increasing by 10%. L483 (850 m) 10% (5 ) increasing by 10%. L483 (450 m) 10% (6 ) increasing by 10%. Contours near the edge of the maps should be ignored due to noisy pixels, less integration time, and inability of the plotting package to handle irregular edges. m, and at 450 m. The solid line indicates the outflow direction. The contour levels are as follows (lowest contour and contour increment in percentage of the peak flux). L1527 (850 m) 10% (4 ) increasing by 10%. L1527 (450 m) 5% (5 ), 10% (8 ) increasing by 10%. B228 (850 m) 5% (4 ), 10% (8 ) increasing by 10%. B228 (450 m) 5% (3 ), 10% (6 ) increasing by 10%. L483 (850 m) 10% (5 ) increasing by 10%. L483 (450 m) 10% (6 ) increasing by 10%. Contours near the edge of the maps should be ignored due to noisy pixels, less integration time, and inability of the plotting package to handle irregular edges. |
|