
|
List of ADS links regarding cloud | List of Simbad links regarding cloud | |||||||||||
|
|
|
List of ADS links regarding cloud | List of Simbad links regarding cloud | |||||||||||
|
| Key: D = Detected ND = Not Detected (---) = no observation made |
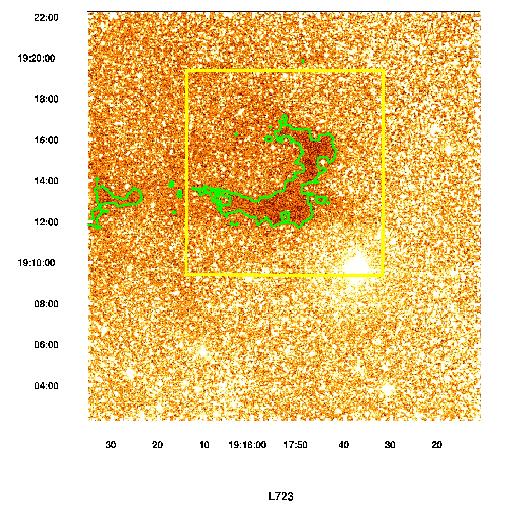
Core L723 | |||||||||||||||||||||||
| Core Name | RA (J2000) | Dec (J2000) | d (pc) | Size (arcmin^2) |
Continuum | IRAS source |
||||||||||||||||||
| h | m | s | deg | ' | " | 1100 (40" aperture) | 850 (40"/120" aperture) | 450 (40"/120" aperture) | ||||||||||||||||
| L723 | 19 | 17 | 53.16 | 19 | 12 | 16.6 | 300 | 5 x 5 | --- | 1.79(0.11) 3.60(0.23) |
8.5(2.1) 12.4(3.1) |
19156+1906 | ||||||||||||
| ||||||||||||||||||||||||
|
||||||||||||||||||||||||


 m, and 450
  ) increasing by 10%. L1527 (450