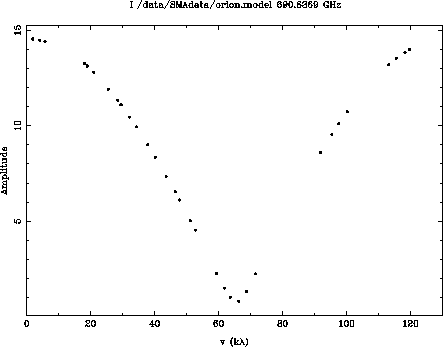
Here we show an example to plot the sinusoid beating amplitude from two point sources. The following lists the parameters for the two point sources contained in the UV data:
Source  1, Object type: point
  Flux (Jy):                      5.883     +/- 1.78E-06
  Offset Position (arcsec):       0.03    -1.81
  Positional errors (arcsec):     1.43E-07 1.81E-07
Source  2, Object type: point
  Flux (Jy):                      6.680     +/- 1.77E-06
  Offset Position (arcsec):       0.23    -0.27
  Positional errors (arcsec):     1.26E-07 1.59E-07
Here is the usage to plot the sinusoid beating amplitude as function of the uv distance:
  Task:   smauvamp
  vis      = /data/SMAdata/orion.model % uv file name
  axis     = vc,amp                    % axis selection
  xrange   = 0,130                     % range in the x-axis
  nbin     = 50                        % 50 bins along the x-axis
  PosA     = 7                         % rotating the uv-plane by 7 deg
                                         to match the v axis along
                                         the line connecting the two
                                         point sources.
  device   = /xs                       % plotting device
The uv plane is rotated by 7 degree so that the transformed
v-axis is in the direction along the connection line between
the two point sources.
 |