|
|
|
|
|
|
|
|
| |
|
SMA MIRIAD Sample Data for High Resolution 2.0 GHz
Script Ver2.0 can be viewed here.
|
|
|
DATE: posted on Feb. 28, 2011
|
Click on image for a larger view.
|
|
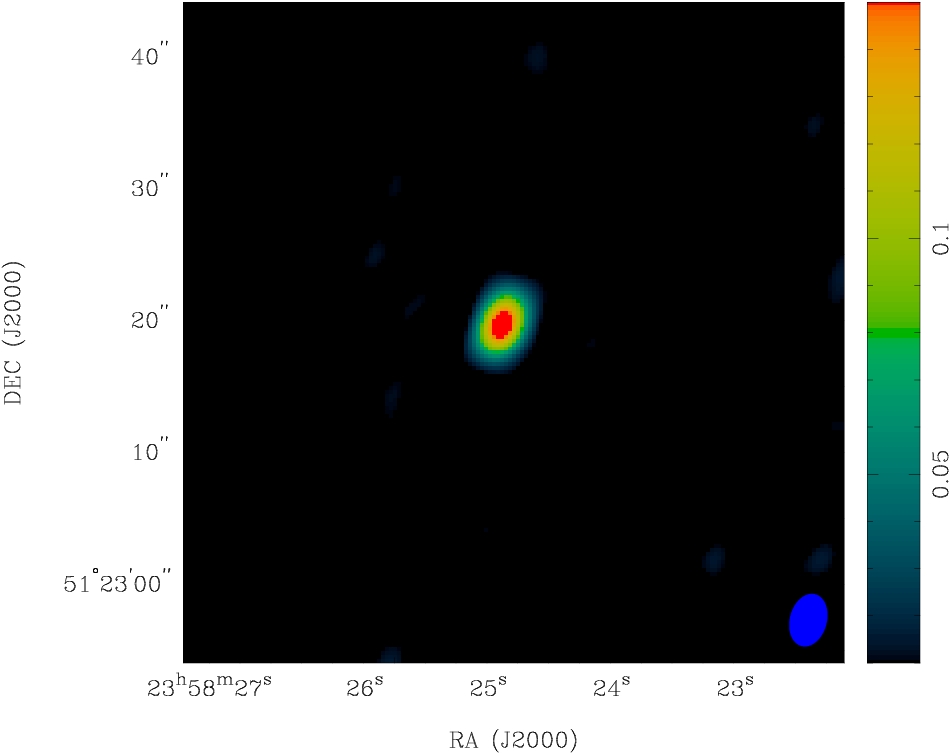
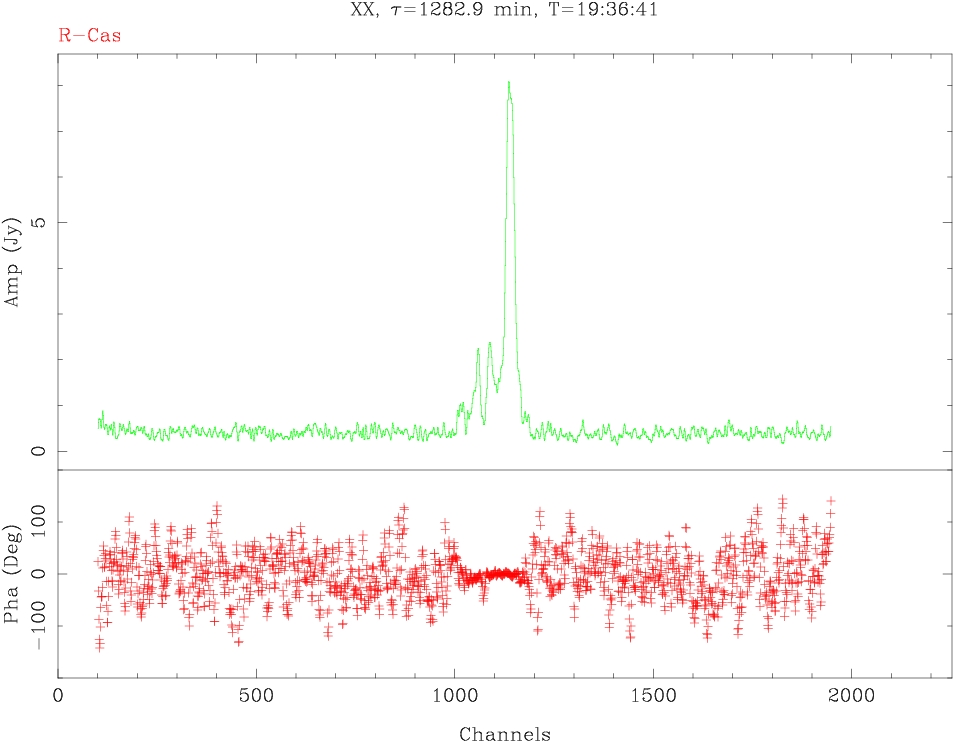
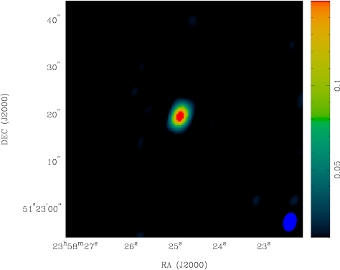
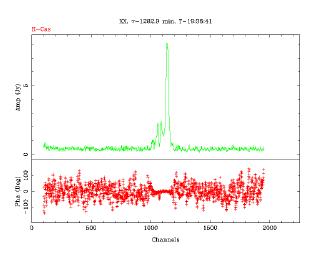
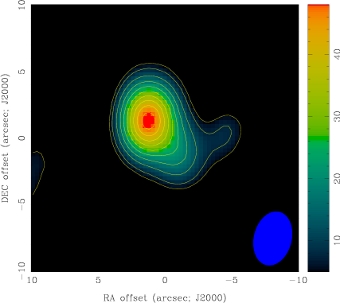
| Fig1(.ps): Continuum image of a target source. | Fig2(.ps): Spectrum from the visibility data. |
|
|
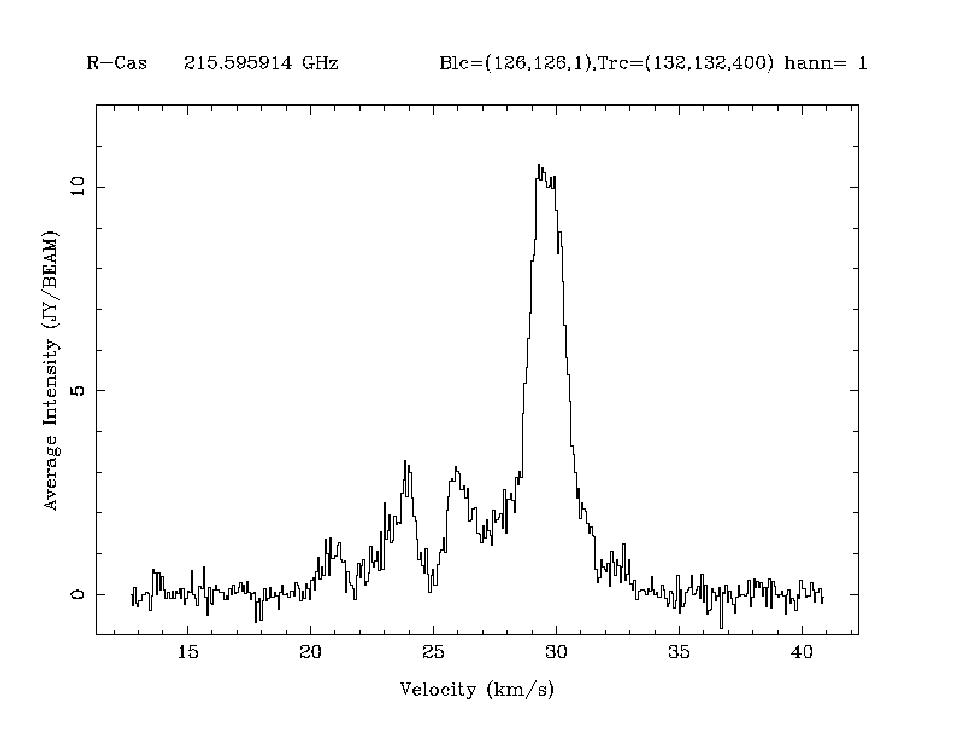
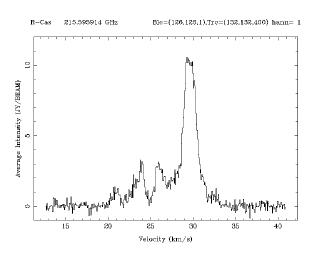
| Fig3(.ps): Spectrum taken from the line image cube. |
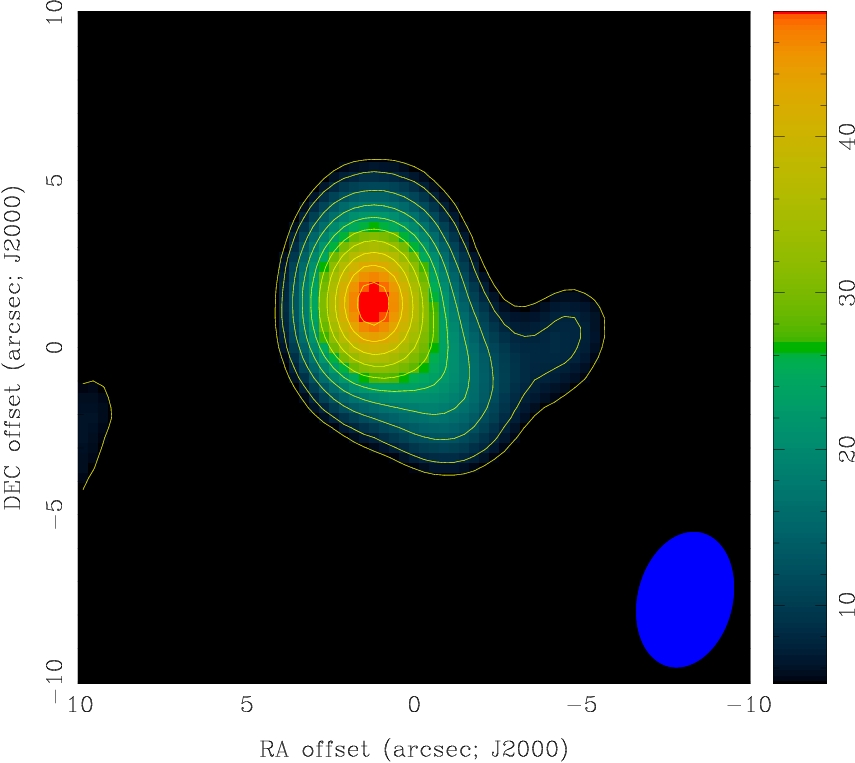
Fig4(.ps): Image of integrated line flux.
|
|