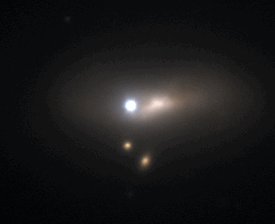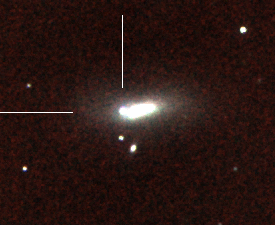

| Optical composite image by Pete Challis | NIR composite image by Andy Friedman | |
|---|---|---|
 |
CfA data of SN 2012cg |  |
|
Home CfA Nearby SNe SN Classification Optical Light Curves NIR Light Curves SN Archive SN Enthusiasts Group Members ESSENCE Pan-STARRS SN Links Publications |
SN 2012cg has a slow decline rate and low expansion velocities.We note that the low expansion velocity and relatively high R_v is consistent with the trend between expansion velocity and R_v for highly reddened SN (Wang et al., 2009, ApJL, 699, 139).
BayeSN simultaneous fitting to BVr'i'JH (Mandel, Narayan, & Kirshner 2011, ApJ 730, 120)BayeSN fits to the data show that SN 2012cg has significant dust extinction (A_v ~ 0.67 mag). We find R_v = 2.7 +/- 0.5, which is consistent with the Milky Way value of 3.1 and mildly inconsistent with the extremely low values reported for some highly reddened SN.
Other BayeSN results: dm15(B) = 0.86 +/- 0.03, dm15(V) = 0.48 +/- 0.03, B-V at Bmax = 0.12 mag, Bmax-Vmax = 0.13 mag.
FLWO PhotometryOIR photometry of SN 2012cg was obtained from May 18 to June 20 UT with the F. L. Whipple Observatory 1.2m telescope (+KeplerCam) and the Peters Automated Infrared Imaging Telescope (PAIRITEL). The optical data were converted to the BVr'i' standard-system following the description in Hicken et al. 2012. They are not s-corrected and no host-galaxy subtraction was performed. The black lines are polynomial fits to the data and the table in the figure refers to the polynomial fits.
B-V colorsBayeSN fits to the data give B-V at Bmax = 0.12 mag and Bmax-Vmax = 0.13 mag.The figure below shows FLWO data and KAIT data (Silverman et al. 2012, ApJL (submitted) arXiv1206.1328) using E(B-V) from BayeSN. Also plotted are predictions for early B-V behavior in the case of interaction with a Red Giant companion to the SN (Kasen 2010, ApJ, 708, 1025). In the model B and V are essentially the same after -14d, so we don't plot those points after -10d.
Optical spectra obtained from May 18 to June 20Spectra obtained with the FLWO 1.5m telescope (+ FAST) and the Hobby-Eberly Telescope (Ramsey et al. 1998) at McDonald Observatory using the Marcario Low-Resolution Spectrograph (Hill et al. 1998) from May 18 through June 20. Narrow absorption features from Na I D and Ca II H&K are strong in all spectra.
Si II 6355 velocitiesThe first spectrum, obtained May 18.8 (15 days before the time of B-band maximum) shows the Si II 6355 A velocity at the absorption minimum of -21,600 km/s. Si II velocities decline quickly with time to -11,300 km/s on May 24 (-8d). The velocity reaches about -10,000 km/s near the time of B_max and stays nearly constant thereafter.
|