 |
Prediction of High-Energy Proton Hazards from CME Shocks: Contributions from Ultraviolet Coronagraph Spectroscopy |
|
Prediction of High-Energy Proton Hazards from CME Shocks: Contributions from Ultraviolet Coronagraph Spectroscopy |
Methodology:
This page describes how ultraviolet spectroscopy, combined with other remote-sensing observations, can be used to determine the initial shock conditions and ambient solar wind properties for the MHD shock propagation models used in theoretical studies of solar energetic particle (SEP) acceleration, transport, and energy spectrum synthesis (e.g., Zank et al. 2000; Li et al. 2003; Rice et al. 2003). Such constraints need to be applied in order to model specific events, such as the massive solar storms of October-November 2003.Below is a list of the coronal plasma conditions that need to be determined in order to accurately model heliospheric shock and SEP events. The extended corona (e.g., 1.5 to 10 solar radii) is emphasized because this is the region where CMEs undergo the bulk of their acceleration and shock steepening. The large-scale shock evolution also depends on the properties at larger distances in the heliosphere (e.g., more than 20 solar radii) that are constrained by in situ and radio sounding measurements and by reasonable extrapolations--such as from mass flux conservation--from the coronal constraints.UVCS/SOHO has measured the properties of more than 200 CMEs since 1996. UVCS spectra, combined with other remote-sensing observations, have provided the most complete description yet of the accelerating CME plasma. UVCS has provided new insights into the roles of shock waves, reconnection, and magnetic helicity in CME eruptions (see, e.g., Raymond 2002). Although UVCS has proven the feasibility of detecting and characterizing CME shocks for several representative events, next-generation instrumentation can provide more extensive diagnostics and more complete spatial and temporal coverage.
SEP acceleration and transport models can be tested for specific events by using spectroscopy and other remote-sensing diagnostics to constrain the initial parameters of the MHD shock in the corona, then comparing with observed SEP energy spectra from, e.g., GOES. Iterative testing and refinement of the model will ultimately result in a comprehensive validation of a predictive SEP model.
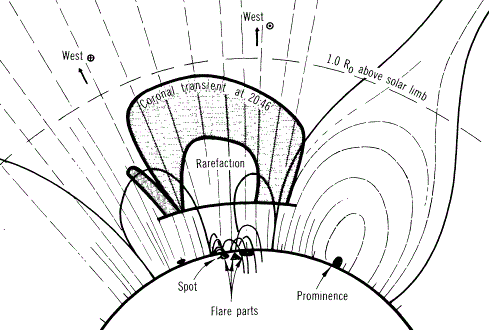
CMEs arise mainly in the slow-speed solar wind associated with streamers and active regions in the corona. The plasma properties of the pre-CME extended corona are key factors in determining how the CME evolves . . .
The following plasma parameters have been determined in many pre-CME coronal structures:
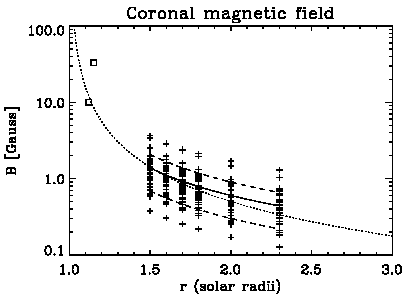
(For more information on the above observations and analyses, see, e.g., Kohl et al. 1997; Raymond et al. 1997; Fineschi et al. 1998; Wang et al. 1998; Raymond 1999; Ko et al. 2002; Strachan et al. 2002; Mancuso et al. 2003; Uzzo et al. 2003; Frazin et al. 2003)
Type II radio bursts give the density at the shock (with some controversy about specific intra-shock locations) versus time. Spectroscopic and coronagraphic determinations of density vs. radius allow the shock radii to be computed.
Measurements of UV line widths (ion temperatures) put strong constraints on the shock onset radius. Line profiles are observed to change noticeably when the CME propagates across the spectrometer field-of-view. If the shock has already formed, the post-shock heating broadens the lines by a large factor (see SHOCK STRENGTH, below). If the shock has not yet formed, the lines remain narrow, with highly redshifted and blueshifted components often appearing as the streamer is blown away transversely (see, e.g., Raymond et al. 2003).
White-light coronagraph image sequences (e.g., LASCO) provide the flow speed of the bulk of the dense CME material (projected in the plane of the sky), but not the shock itself. Type II radio bursts, convolved with a density model, give an approximate radial shock speed (i.e., the first derivative of the shock radius vs. time).
Mancuso and Raymond (2004) utilized a more realistic shock/streamer geometry, combined with UVCS density measurements, to put better empirical constraints on the shock and CME speeds:

The resulting speeds showed that the shocks typically flow slightly faster than the underlying CME plasma, as expected from theories of, e.g., piston-driven shocks. For 29 events in 1999, the plot below shows how the CME speed correlates with the Type II shock speed:

The compression ratio of the shock can be estimated in cases where the Type II radio burst data is observably ``split'' between fundamental and harmonic bands. In some cases it is possible to identify certain bands with the density just ahead of the shock, and some with the density just behind the shock, thus allowing the compression ratio to be computed (e.g., Vrsnak et al. 2002).
An independent determination of the shock compression ratio can be made for UV spectroscopic observations of multi-ion shock heating. Using the theory of nonadiabatic motion of ions crossing thin collisionless shocks (e.g., Lee et al. 1987; Lee and Wu 2000) one can compute the perpendicular gyration velocity of ions as a function of charge and mass for a range of possible shock compression ratios. Adopting the gyration velocity as the line-of-sight most-probable speed (i.e., Doppler-broadened line width), this method can be used to find the compression ratio that agrees with a number of observed ion widths.
For a CME on March 3, 2000, H I Lyman alpha (a proxy for protons)
and O VI 1032, 1037 line profiles were measured by UVCS to have
drastically different widths after the CME passed by the slit.
The compression ratio inferred from Type II band splitting was
1.8, and the hydrogen line width broadened by about a factor of 1.6
(see
Mancuso et al. 2002).
This is roughly consistent with adiabatic compression,
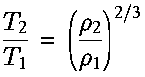
where the compression ratio is the ratio of post-shock density (rho2) to pre-shock density (rho1).
The O VI line profiles were seen to become broader than the Lyman alpha profiles by about a factor of two. These observations constrained the collisionless shock theory discussed above, and the analysis yielded the following values (curves: theory, horizontal bars: observed widths, for protons [red] and oxygen [blue]):
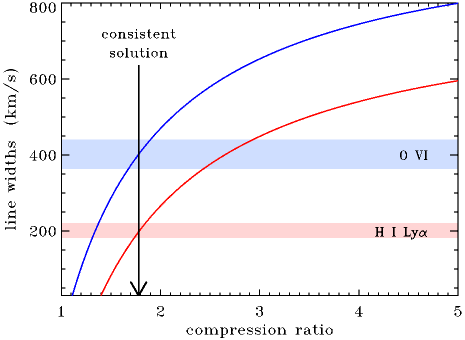
i.e., a compression ratio of about 1.8 was the only value consistent with both line widths, and this was the same value obtained from the Type II band-splitting analysis discussed above. Note, however, that not all Type II burst measurements contain enough detail to perform the band-splitting determination of the compression ratio, and the UV spectral constraints may be useful in determining this parameter for a much larger fraction of events.
| GO BACK TO: | top-level UVCS/SEP prediction page |
| UVCS/SOHO home page |