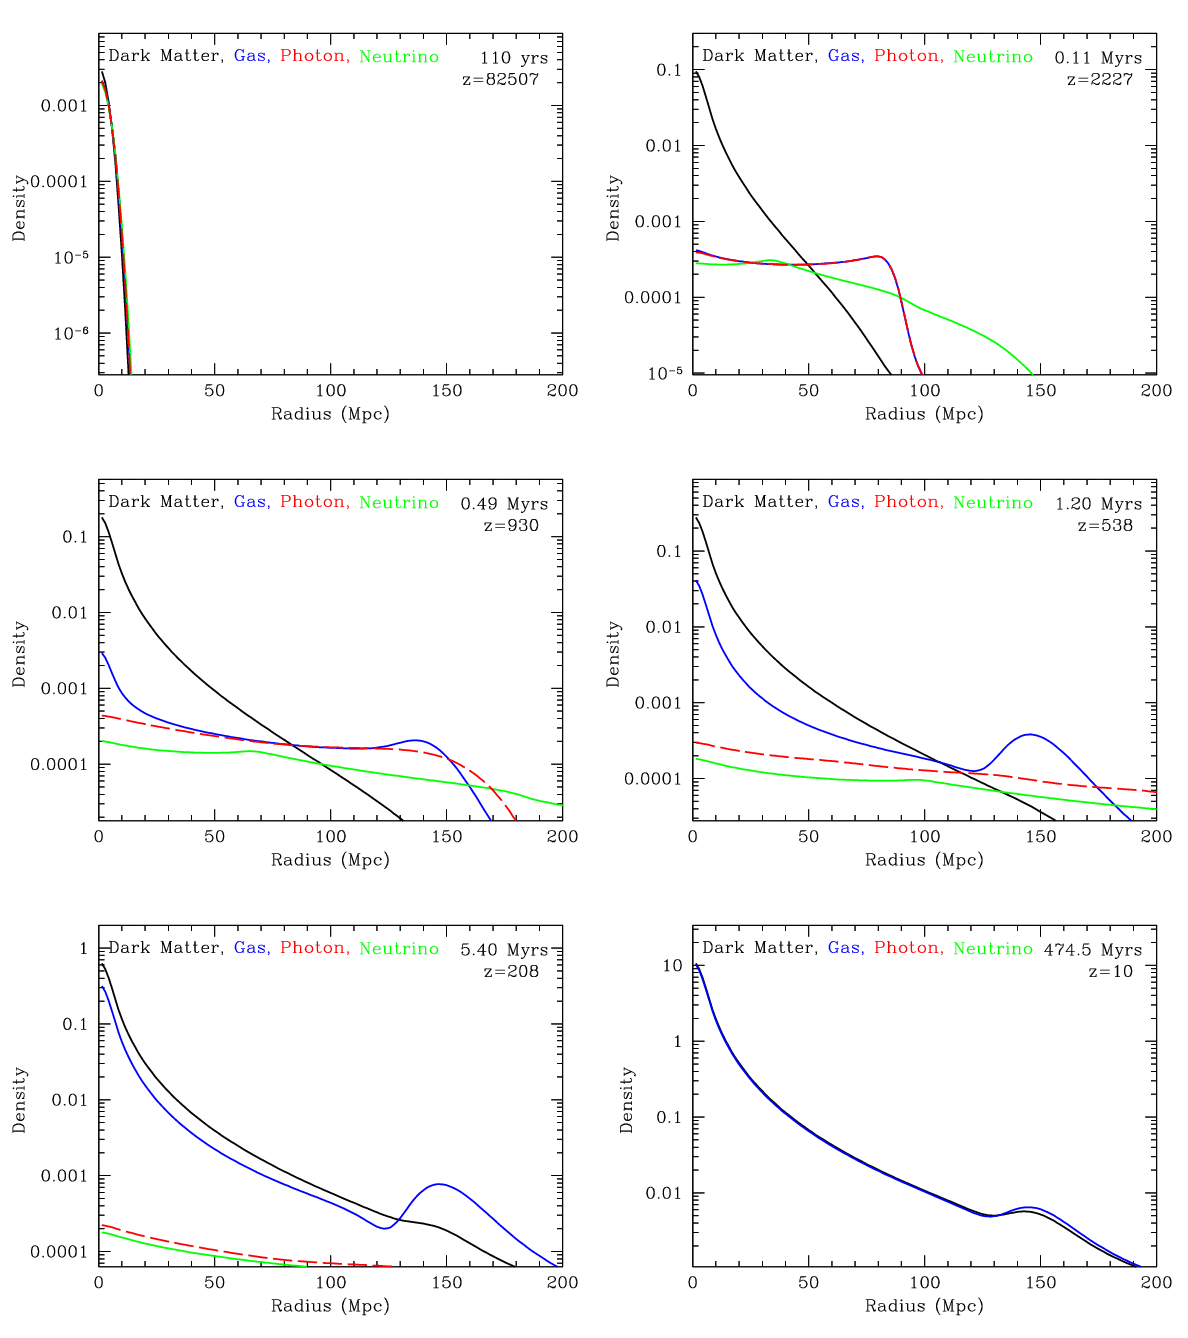
This movie shows the evolution of a initial point-like density fluctuation. The density of four species is shown: dark matter (black), gas (blue), microwave background photons (red), and neutrinos (green). We have plotted the comoving fractional density of each species, holding the normalization consistent between the time slices. In other words, if two curves are the same height, then the fractional perturbation is the same in the two species. However, the absolute densities would be different: the dark matter would be 5 times denser than the baryons, which the photons and neutrinos would be changing relative to the gas and dark matter. All time slices are on the same scale, i.e. you can compare the fractional densities between epochs.
Radius is in megaparsecs (Mpc) as it would be measured today. The universe is expanding and so two given points today were separated by less distance in the past. This means that it would take light less time to travel from one to the other, so in the first million years after the Big Bang, the wave can travel a distance that today is far more than one million light-years. It is easier to understand what's happening if one focuses on what would be seen by observers moving with the expanding universe. That's what our choice of distance convention does. This convention is called the comoving coordinate system.
1 Mpc is 3.26 million light years, so 150 Mpc is about 500 million light-years.
The frames have been chosen so that at early times a light ray would travel at uniform speed (i.e. equal conformal time) across the screen. However, we accelerate the movie after redshift 410 and again after 80, so you'll see a couple of artificial changes in speed.
Remember that all of these perturbations are small, typically only a part in a thousand at high redshift. Also, the actual density field in the universe is composed of many such perturbations, both positive and negative, arising from all points in space. So we don't get to see this nice spherical shell pattern, but only the imprint of it in the statistical correlations.
For a detailed explanation of the phenomena in the animation, see this page.
 Back to CfA Home Page