
2MRS is now finished and public!
The final survey is 97.6% complete to a limiting magnitude of K=11.75 over 91% of the sky, and contains almost 45,000 galaxies.A page of images of the final survey can be found here.
You can download the data from SAO/TDC.
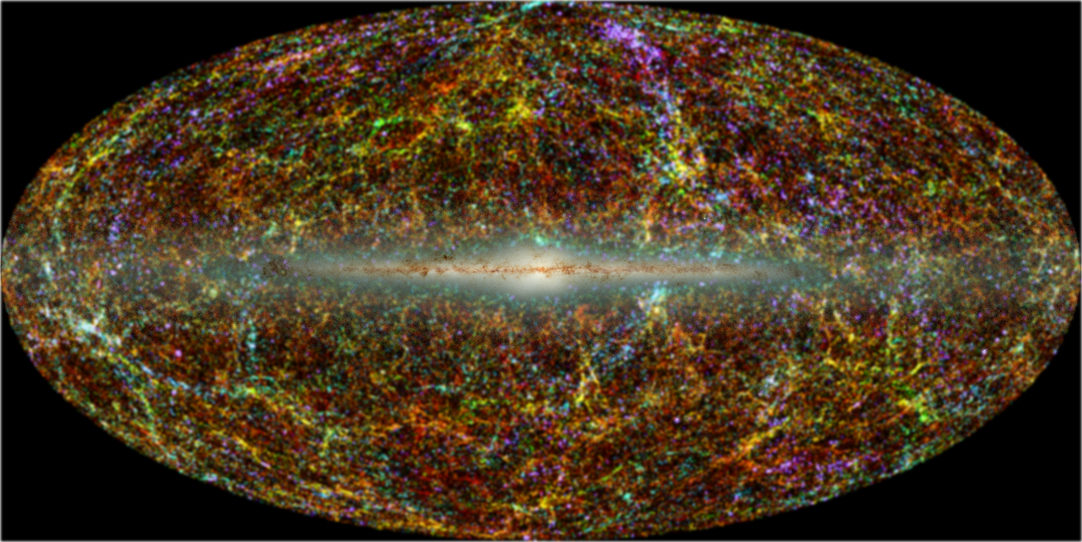 |
| The Infrared Local Universe: this all-sky map shows galaxies in the 2MASS survey color coded by their distance from us with blue showing the nearest sources, through green to the most distant sources shown in red. Read more about this image here. |
Take a tour through the 2MRS data: Quicktime movie
See the redshift layers being added: Quicktime movie
Goals of the 2MASS Redshift Survey
The 2MASS Redshift Survey (2MRS) aims to map the distribution of galaxies and dark matter in the local universe, out to a mean redshift of z = 0.03 (roughly equivalent to 115 Mpc or 370 million light-years).
2MRS is based on galaxy selection in the near infra-red from the Two Micron All-Sky Survey (2MASS). 2MASS has now mapped all of the sky in the near infra-red J, H and K-bands. This photometric survey is complete and fully available to the public (IRSA). The 2MASS extended source catalog (XSC) includes roughly half a million galaxies to a limiting K magnitude of K=13.5 mag.
2MRS ultimately aims to determine the redshifts of all galaxies in the XSC to a magnitude of K=12.2 mag (about 100,000 galaxies) and to within 5 deg of the Galactic plane. The second phase of 2MRS is now complete, providing an all-sky survey of 45,000 galaxies with redshifts to a limiting magnitude of K=11.75 mag.
2MRS is the densest sampled all-sky redshift survey to date and its selection in the near infra-red reduces the impact of the zone of avoidance (where the plane of our own Galaxy obscures extragalactic objects).
2MRS provides complementary redshift information to deeper surveys
like SDSS and the 2dFRGS which cover much
smaller fractions of the sky. It improves on the IRAS redshift survey
IRAS
PSCz which was not able to distinguish galaxies in regions of high
density (ie. clusters).
Survey Strategy
In the Southern hemisphere, many 2MASS galaxies were observed as part of the 6dFRGS which used the 6dF multi-fiber spectrograph on the 1.2m UK Schmidt in Siding Springs, Australia to map 150,000 2MASS galaxies in the Southern sky to a magnitude limit of K=12.75 mag and to within 10 deg of the Galactic plane. This survey is deeper than the stated goal of 2MRS, but also has a higher Galactic latitude limit. Southern hemisphere galaxies not observed by 6dFGS were added to 2MRS from observations at CTIO.
In the Northern hemisphere the 2MRS builds on a strong tradition of
redshift surveys at the CfA: the
CfA redshift survey
and ZCAT.
In the absence of a northern hemisphere equivalent to the 6dF, new
redshift observations were done galaxy by galaxy using the 1.2m
telescope at the Fred Lawrence
Whipple Observatory on Mt. Hopkins, AZ. The average density of galaxies at the magnitudes 2MRS is observing is about 1 per degree so without a wide-field multi-object spectrograph in the Northern hemisphere this remains the most efficient way to get new redshifts.
Survey Status
The K=11.75 mag 2MRS is now complete and has been made public
through SAO/TDC. This
phase of the survey contains ~44,500 galaxies.
Highlights of Results
1. The 2MRS Dipole
The acceleration on the Local Group from 2MRS galaxies has been calculated by Erdogdu etal. 2006a. The dipole estimate seems to converge to the CMB result within 60 Mpc/h, suggesting that the bulk of the LGs motion comes from structures within that distance.
2. Clustering
A friends of friends algorithm has been used to identify groups and clusters in the complete 11.25mag limited 2MRS. The high source density of 2MRS means that many new groups and clusters have been identified. This work is published in Crook etal. 2007.
3. The Local Density Field
Density and velocity fields have been calculated by Erdogdu etal 2006b for the K=11.25mag limited 2MRS (23,200 galaxies) using a method which expands the fields in Fourier-Bessel functions, and uses a Wiener filter to supress shot noise errors. All major local superclusters and voids are successfully identified, and backside infall onto the "Great Attractor" region (at 50 Mpc/h) is detected.
The Royal Astronomical Society released a press release on this work.
4. Galaxy correlation Functions
For his thesis project at Harvard, Mike Westover worked on the
correlation functions of galaxies in 2MRS. Because the NIR traces
stellar mass directly, and is not affected by recent star formation,
this correlation will measure a fundamentally different thing than
previous published versions using optical surveys (Westover 2007, PhD
Thesis, Harvard University).
Related Projects
A 2MASS Peculiar Velocity Survey
The peculiar velocities of galaxies provide a powerful tool to map the distribution of mass in the universe independent of whether or not it emits light. We plan to use the luminosity-rotation velocity (or Tully-Fisher) relation to measure redshift independent distances (and therefore peculiar velocities) for roughly 6000 of the most edge-on spiral galaxies in the Ks=11.25mag limited 2MRS. Published rotation velocities are available for roughly half of this sample and in the past few years we have observed close to 1000 galaxies at the Green Bank Telescope in West Virginia, completing the sample North of DEC=38 deg, and down from the celestial equator to DEC=-45 deg. The ALFALFA survey at Arecibo will observe all HI rich systems in the high Galactic latitude sky between DEC=0-38 deg. We have also carried out observations at the Parkes Radio Telescope in Australia to fill in objects south of DEC=-45 deg. The NIR Tully-Fisher template was published by Masters et al. (2008).
This work has been supported by the National Science Foundation (under award ASR0406906) and by contributions from various organizations and universities including Harvard, NOAO, University College London, and NASA/IPAC. Any opinions, findings, and conclusions or recommendations expressed in this material are those of the author(s) and do not necessarily reflect the views of the National Science Foundation.
|
Page no longer maintained |