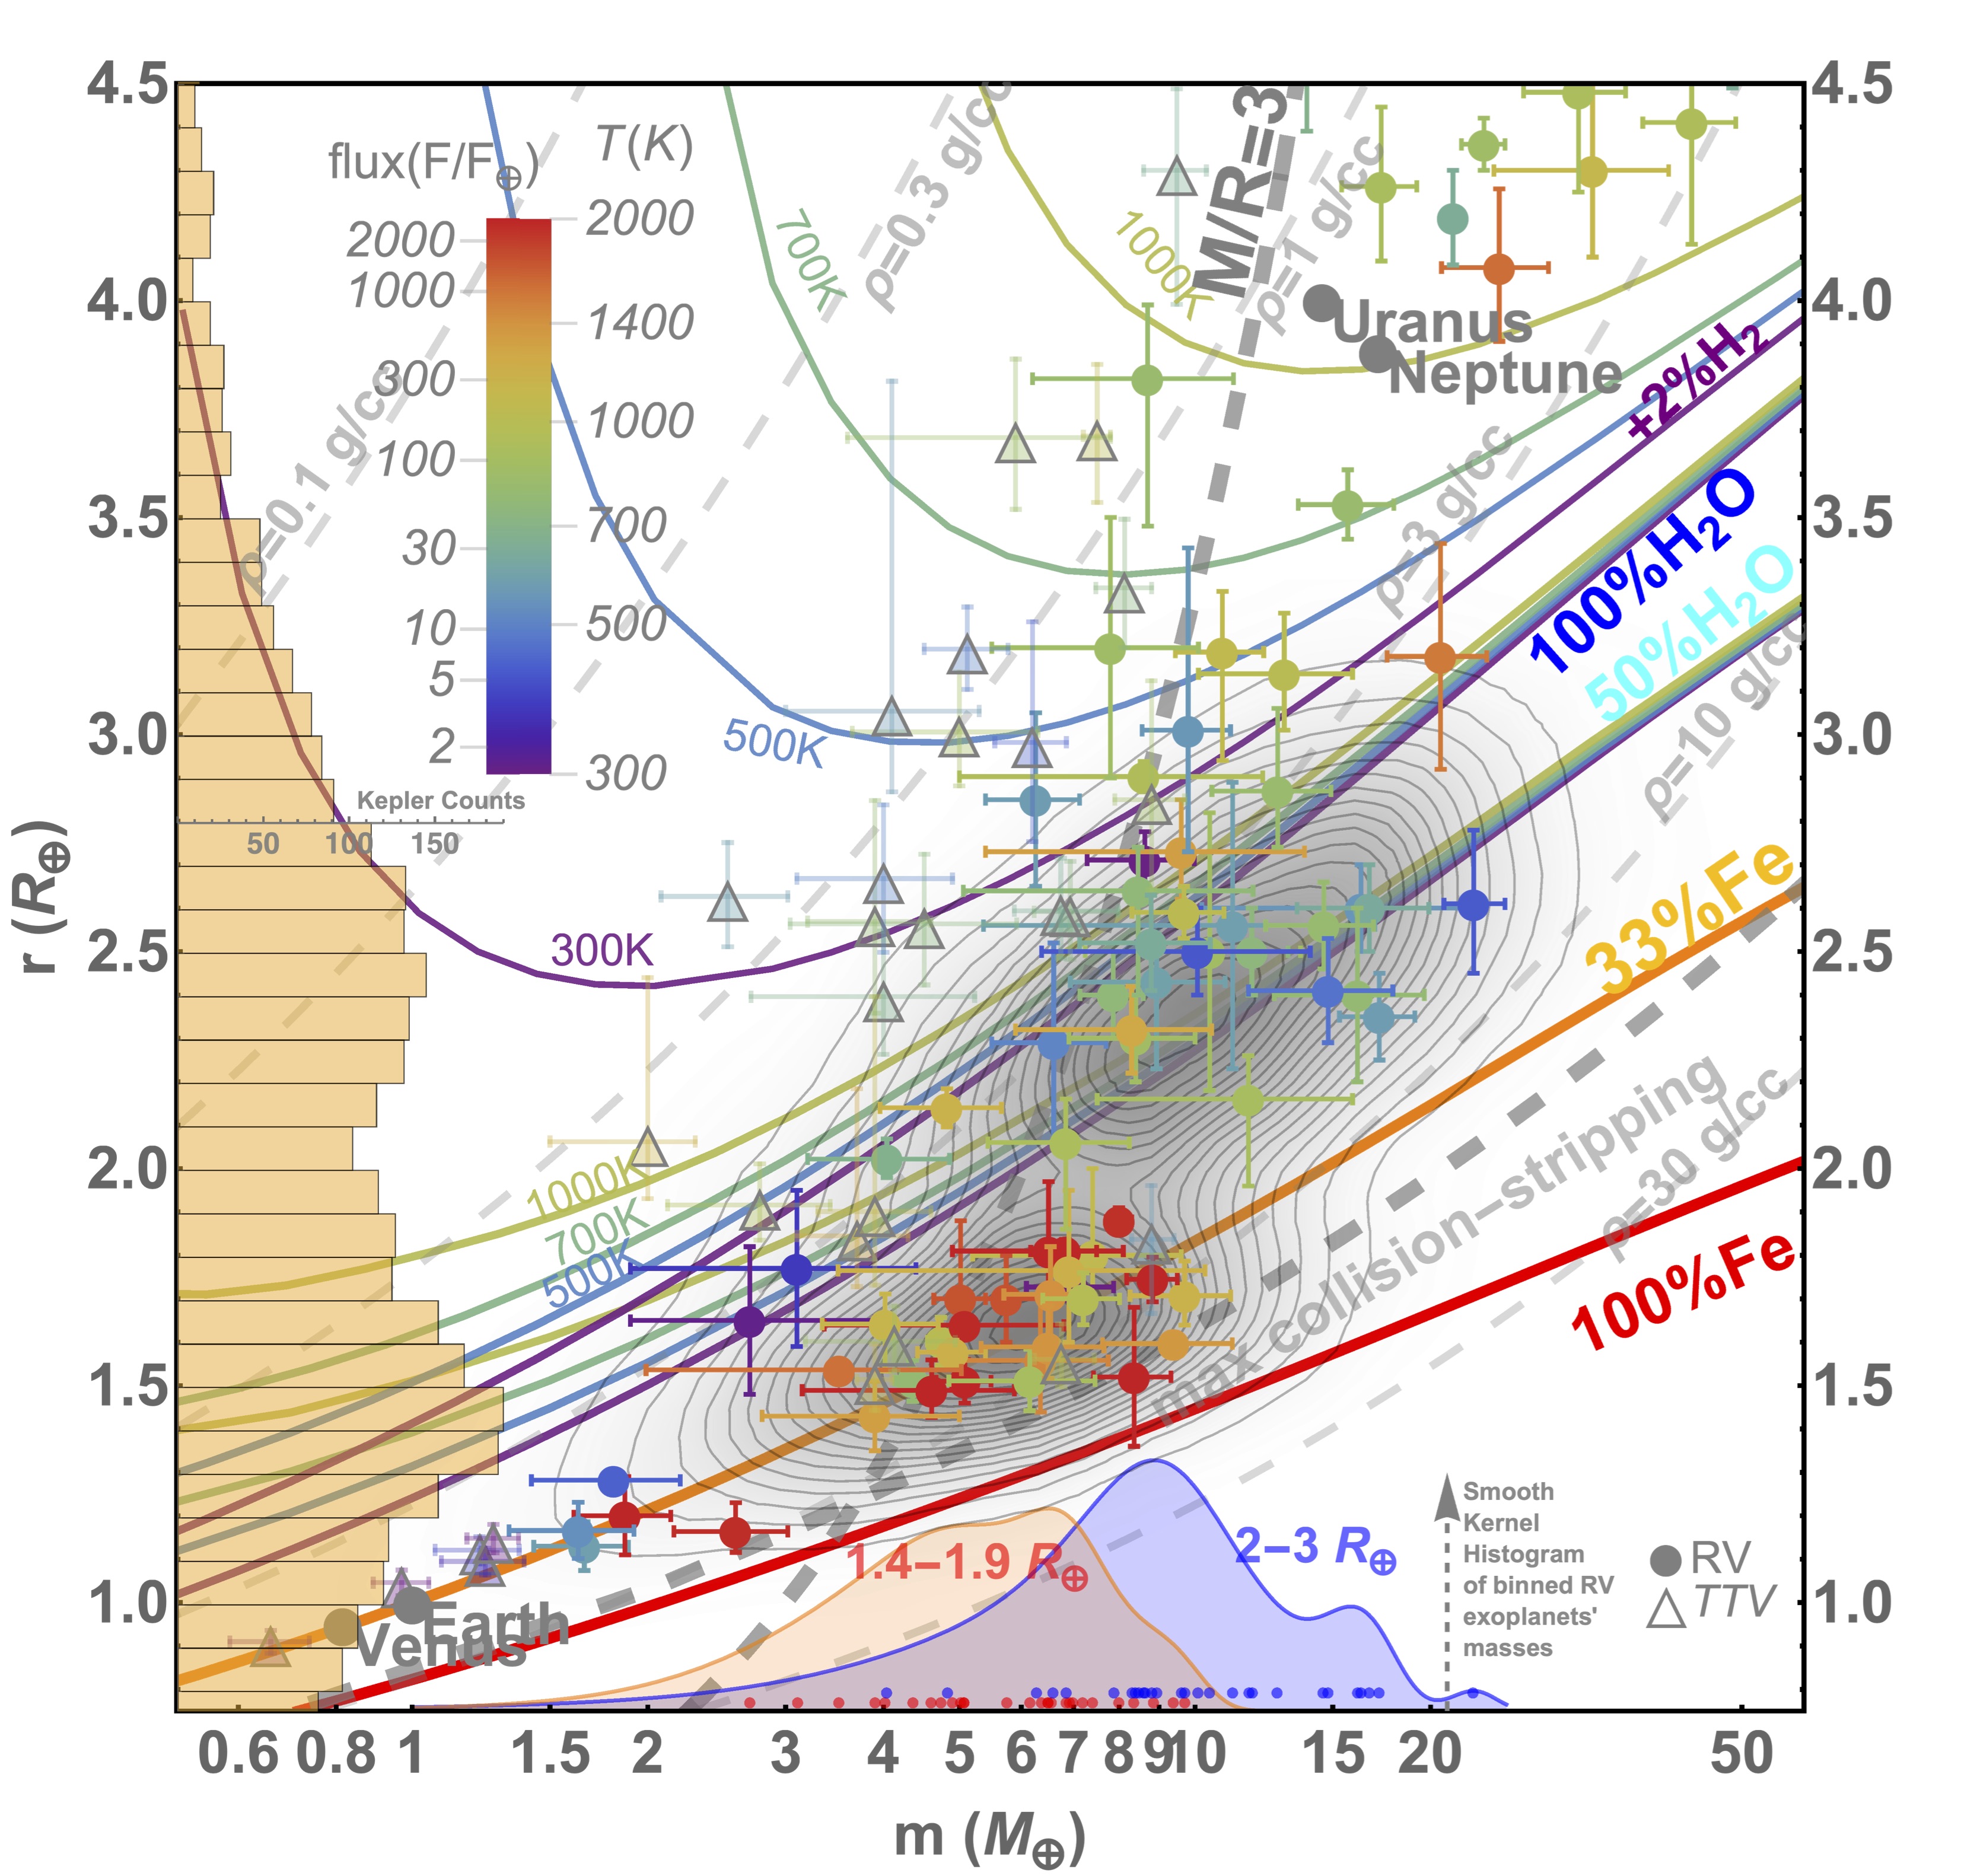
★Planets below 4.5 Earth radii
References:
“Growth Model Interpretation of Planet Size Distribution”. Li Zeng, Stein B. Jacobsen, Dimitar D. Sasselov, Michail I. Petaev, Andrew Vanderburg, Mercedes Lopez-Morales, Juan Perez-Mercader, Thomas R. Mattsson, Gongjie Li, Matthew Z. Heising, Aldo S. Bonomo, Mario Damasso, Travis A. Berger, Hao Cao, Amit Levi, Robin Wordsworth. PNAS, 2019, 116 (20) 9723-9728. DOI: 10.1073/pnas.181295116 (https://www.pnas.org/content/116/20/9723)
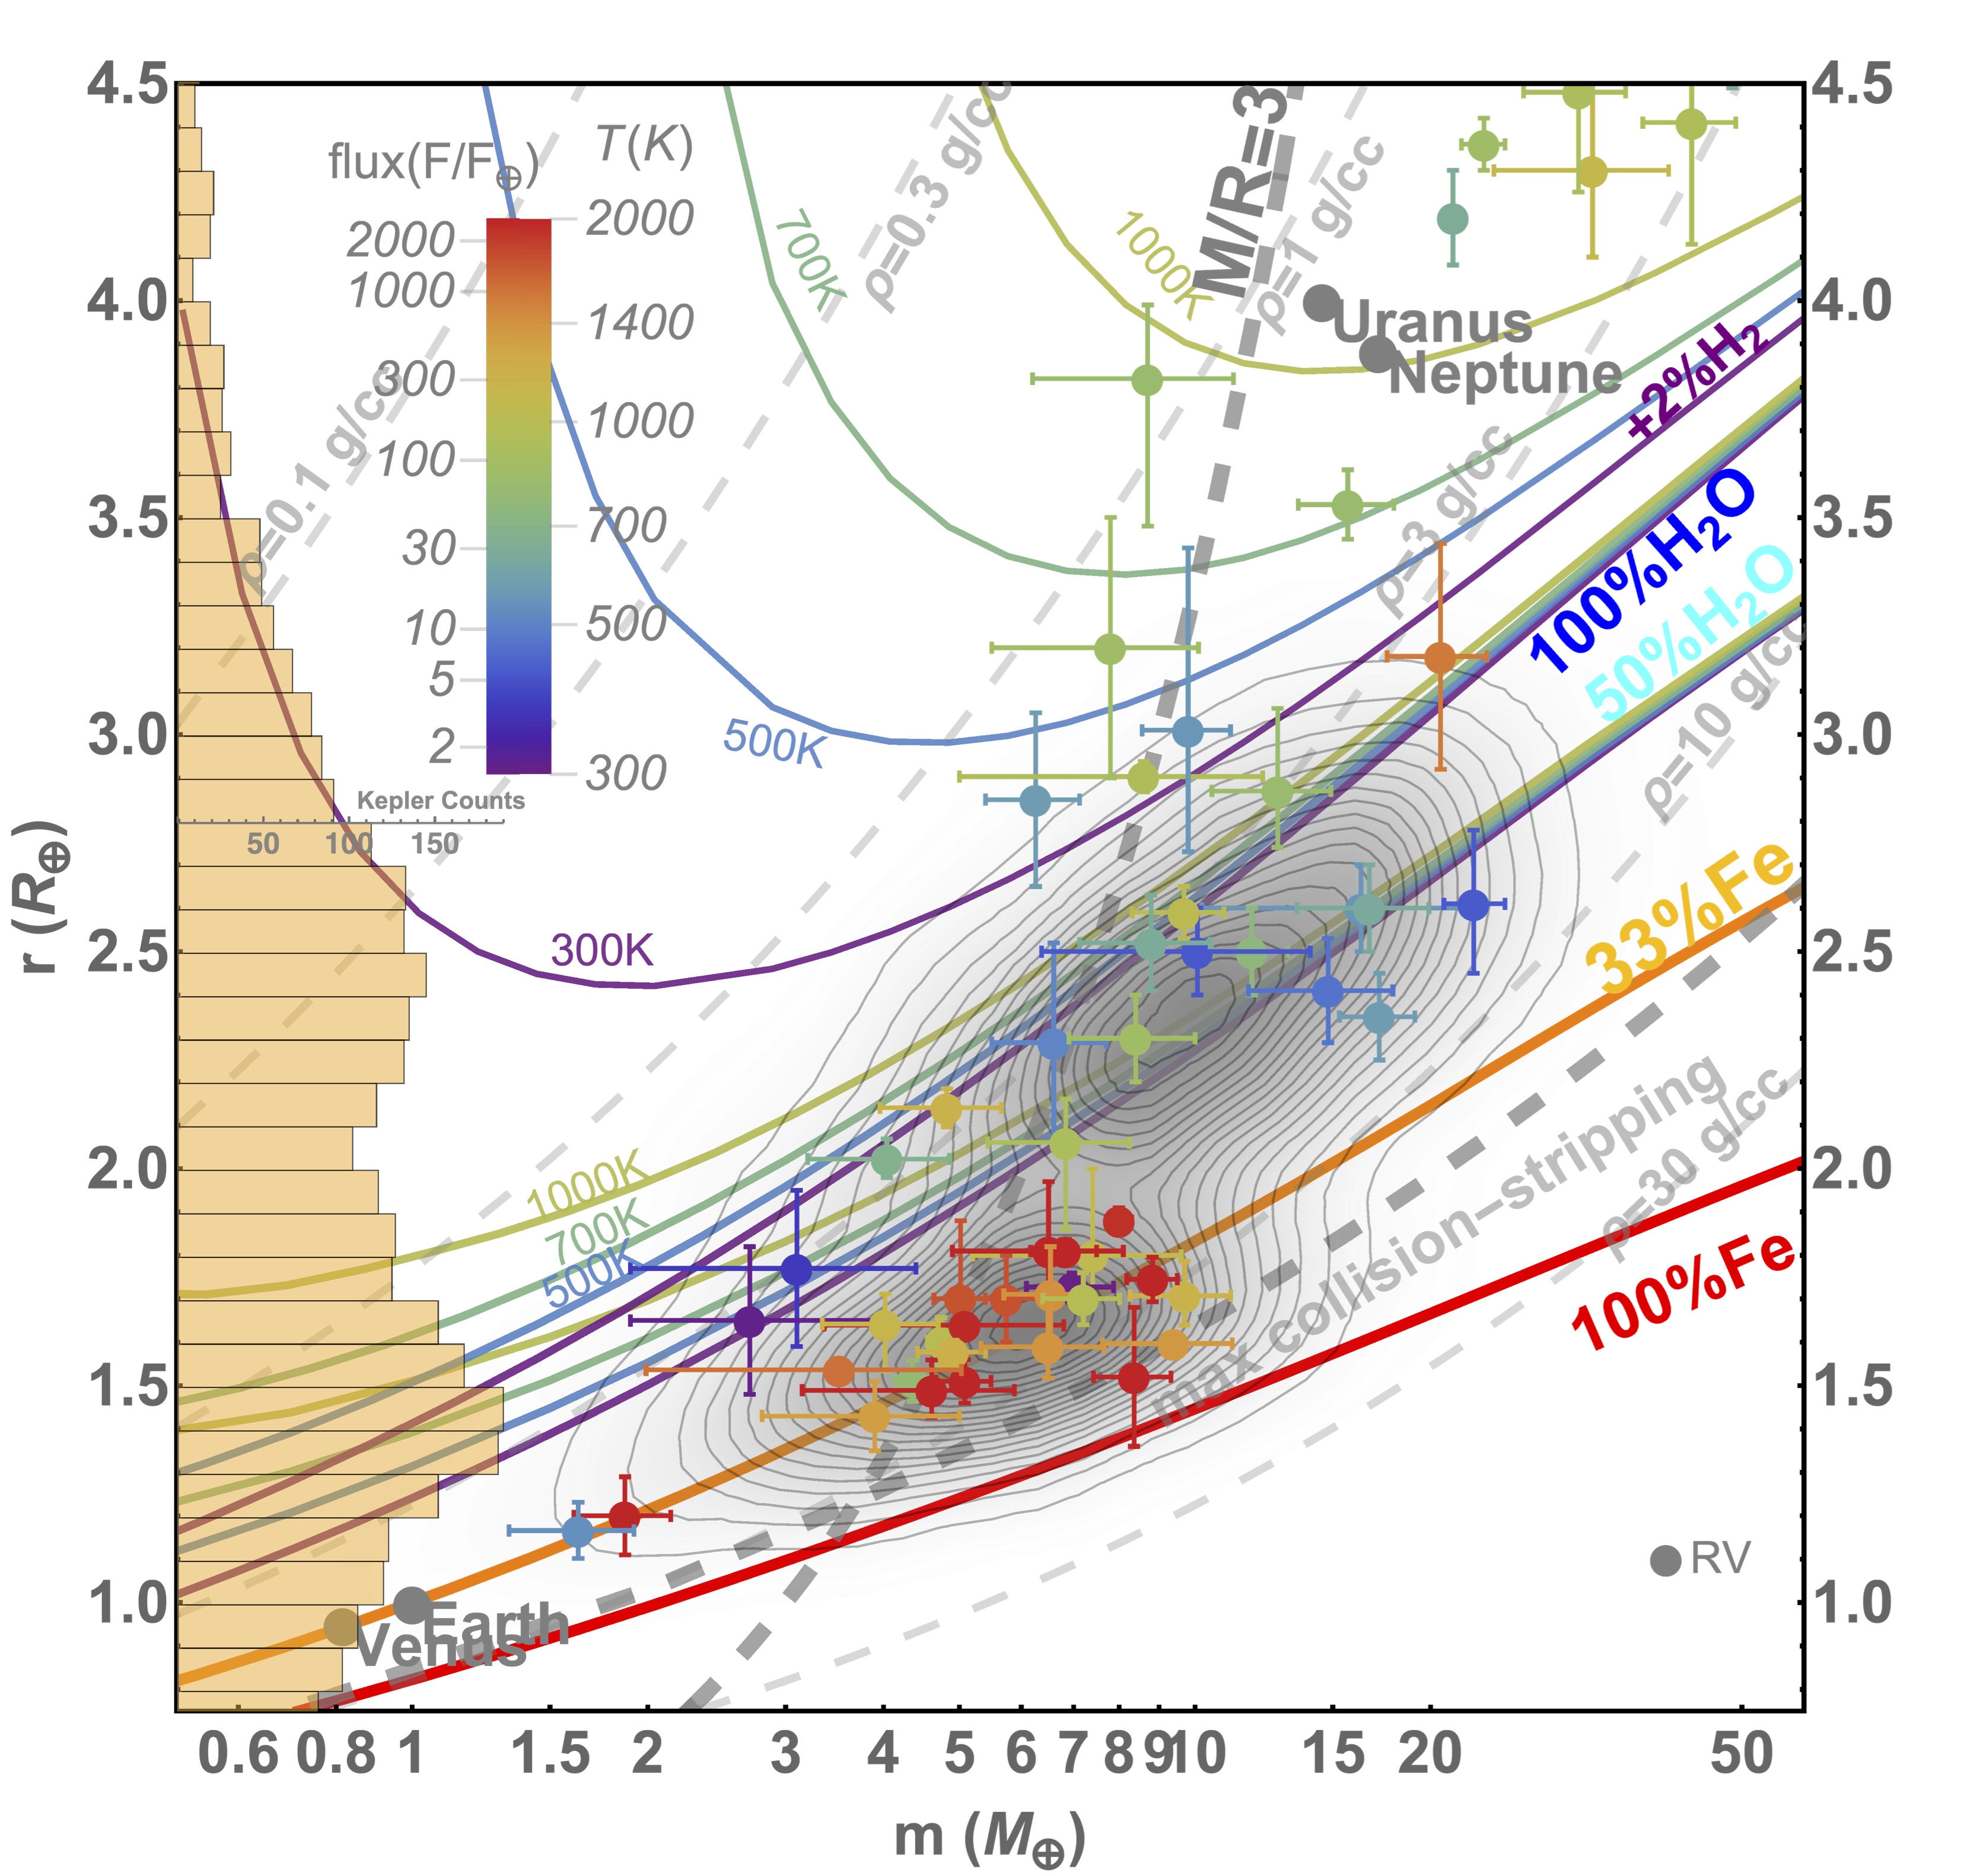
★HARPS-N ONLY
All Planets (updated 2019/05)
HARPS-N Only (updated 2019/05)
Note: The data are from NASA Exoplanet Archive (http://exoplanetarchive.ipac.caltech.edu), with modifications.
(3) Mass-Radius Curves Download:
Masses and Radii are in Earth Units
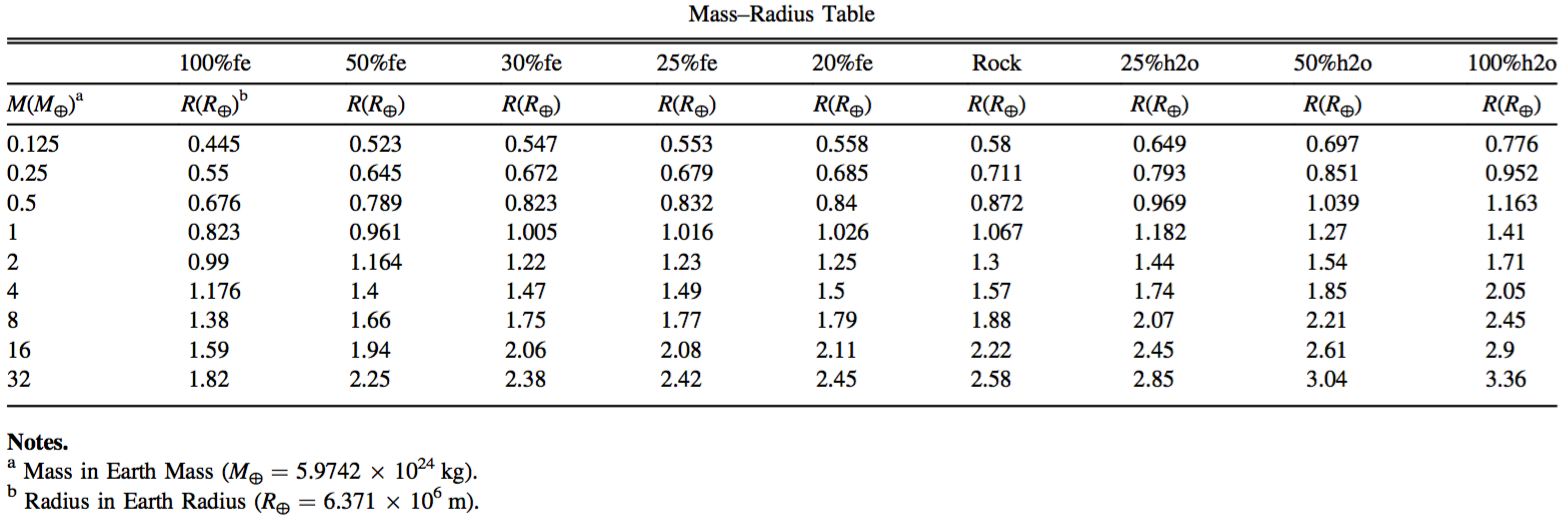
★Table 1:
pure-Iron (100% Fe) / Earth-like Rocky (32.5% Fe+67.5% MgSiO3) / pure-Rock (100% MgSiO3) / cold-Hydrogen (isentrope, Becker et al. 2014 ApJS) / Maximum Collision Stripping (Marcus et al. 2010, PDF)
★Add Volatiles and Temperature Effect
Considering Isothermal Atmosphere/Light Envelope, truncating at 1 milli-bar (100 Pa) surface pressure level (Defining the Radius of Planet),
because milli-bar level is typically what transiting observations probe
Add H2O-gaseous atmosphere at various temperatures (Kelvin):
100% H2O (pure-H2O), assuming 1milli-bar surface pressure level:
300 K / 500 K / 700 K / 1000K /
50% H2O (50% Earth-like rocky core + 50% H2O layer by mass), assuming 1milli-bar surface pressure level:
300 K / 500 K / 700 K / 1000K /
Add H2-atmosphere/envelope onto Water-rich Cores:
0.1% H2 envelope (49.95% Earth-like rocky core + 49.95% H2O layer +0.1% H2 envelope by mass), assuming 1milli-bar surface pressure level:
300 K / 500 K / 700 K / 1000K /
0.3% H2 envelope (49.85% Earth-like rocky core + 49.85% H2O layer +0.3% H2 envelope by mass), assuming 1milli-bar surface pressure level:
300 K / 500 K / 700 K / 1000K /
1% H2 envelope (49.5% Earth-like rocky core + 49.5% H2O layer +1% H2 envelope by mass), assuming 1milli-bar surface pressure level:
300 K / 500 K / 700 K / 1000K /
2% H2 envelope (49% Earth-like rocky core + 49% H2O layer +2% H2 envelope by mass), assuming 1milli-bar surface pressure level:
300 K / 500 K / 700 K / 1000K /
5% H2 envelope (47.5% Earth-like rocky core + 47.5% H2O layer +5% H2 envelope by mass), assuming 1milli-bar surface pressure level:
300 K / 500 K / 700 K / 1000K /
Add H2-atmosphere/envelope onto Earth-like Rocky (32.5% Fe+67.5% MgSiO3) Cores:
0.1% H2 envelope (99.9% Earth-like rocky core + 0.1% H2 envelope by mass), assuming 1milli-bar surface pressure level:
300 K / 500 K / 700 K / 1000K / 2000K /
0.3% H2 envelope (99.7% Earth-like rocky core + 0.3% H2 envelope by mass), assuming 1milli-bar surface pressure level:
300 K / 500 K / 700 K / 1000K / 2000K /
1% H2 envelope (99% Earth-like rocky core + 1% H2 envelope by mass), assuming 1milli-bar surface pressure level:
300 K / 500 K / 700 K / 1000K / 2000K /
2% H2 envelope (98% Earth-like rocky core + 2% H2 envelope by mass), assuming 1milli-bar surface pressure level:
300 K / 500 K / 700 K / 1000K / 2000K /
5% H2 envelope (95% Earth-like rocky core + 5% H2 envelope by mass), assuming 1milli-bar surface pressure level:
300 K / 500 K / 700 K / 1000K / 2000K /
References:
“Growth Model Interpretation of Planet Size Distribution”. Li Zeng, Stein B. Jacobsen, Dimitar D. Sasselov, Michail I. Petaev, Andrew Vanderburg, Mercedes Lopez-Morales, Juan Perez-Mercader, Thomas R. Mattsson, Gongjie Li, Matthew Z. Heising, Aldo S. Bonomo, Mario Damasso, Travis A. Berger, Hao Cao, Amit Levi, Robin Wordsworth. PNAS, 2019, 116 (20) 9723-9728. DOI: 10.1073/pnas.181295116 (https://www.pnas.org/content/116/20/9723)
★Table 2:
Varying Proportion of Major Planet-Building Components (Iron, Rock, Ices)
Bi-layer Planet Models (Fe-Rock or Rock-H2O) without Atmospheres:
Small Table: Click Here.
Medium Table: Click Here.
Large Table: Click Here.
Note on Equation of States (EOS): (1) Fe-alloy in the core is assumed to be liquid, just as the Earth's outer core, which dominates over the solid inner core. Solid inner core likely grows from the solidification of the liquid outer core over time, and more massive planets likely possess liquid core due to higher heat content. (2) Mg-silicates are assumed to be solid, just as the Earth's mantle. Both Fe and Mg-silicates are extrapolated from the Seismically-determined Density Profile of the Earth (Preliminary Reference Earth Model, known as PREM). (3) H2O is assumed to be in solid phase (Ice Ih, Ice III, Ice V, Ice VI (Chaplin's website), Ice VII (Frank et al. 2004 (PDF)), Ice X (French et al. 2009 (PDF))) along its melting curve. (4) Cold "zero-temperature" H2/He EOS is used for the calculation (Seager et al. 2007 (PDF)). (5) At extremely high pressure, modified Thomas-Fermi-Dirac EOS (Salpeter & Zapolsky 1967 (PDF), Zapolsky & Salpeter 1969 (PDF)) is assumed for all components.
References:
“Mass-Radius Relation for Rocky Planets based on PREM”. Li Zeng, Dimitar D. Sasselov, and Stein B. Jacobsen. ApJ, 819, 127, 2016. (ADS link) (PDF)
Any questions, comments, or suggestions are very welcome, please feel free to email me astrozeng@gmail.com
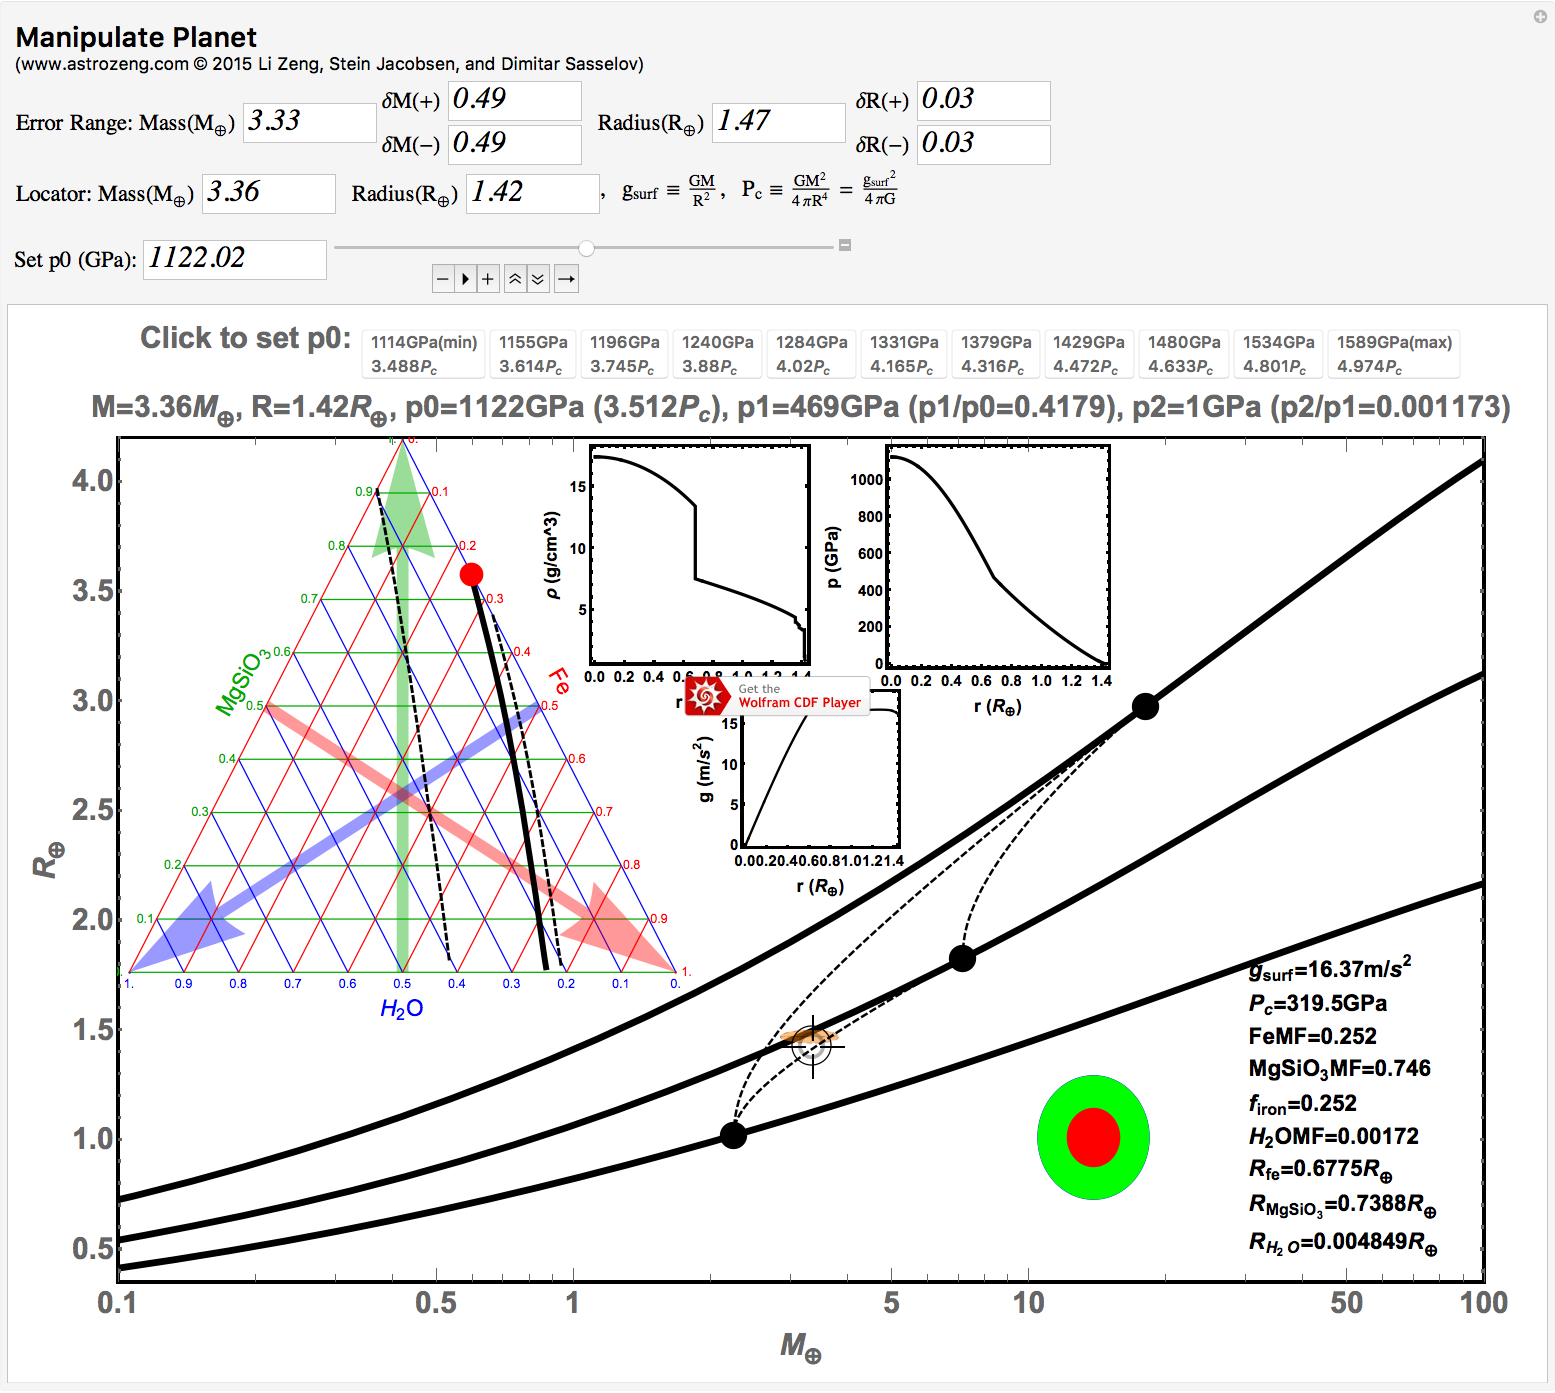
Manipulate Planet
★Manipulate Planet numerically solves the interior structure of a planet based on the Equation of State (EOS) extrapolated from Earth's Seismic Density Profile (PREM). It requires Wolfram Mathematica or the free Wolfram CDF player to run on your computer. (updated 2015/12)
To download the tool, click here (.cdf file): manipulateplanet.cdf
References:
(1) “Mass-Radius Relation for Rocky Planets based on PREM”. Li Zeng, Dimitar D. Sasselov, and Stein B. Jacobsen. ApJ, 819, 127, 2016. (ADS link) (PDF)
(2) “A Detailed Model Grid for Solid Planets from 0.1 through 100 Earth Masses”. Li Zeng and Dimitar D. Sasselov. PASP, 125, 227, 2013. (ADS link) (PDF)
Note for ManipulatePlanet: (1) Confirm "Enable Dynamics" at the upper right-hand corner when necessary, to allow it run. (2) Be patient, it may take a while (up to ~30 seconds) to load. If too slow, try relaunchinng it or restart your computer. (3) When click the Locator (Locator refers to the Target-shaped object which can be dragger around by your mouse to any desired location. It is where the calculation actually takes place.), please wait one second before dragging it around, to allow it enough time to respond and calculate. DO NOT release the click during the entire dragging process until the Locator is moved to the desired location in the mass-radius diagram. (4) This interactive tool is for research & education purpose only, all rights reserved. (5) Mass and Radius uncertainties (δM+/-, δR+/-) can be shown as as an uncertainty ellipse on the M-R diagram. (6) Central Pressure (p0) in GPa (10^9 Pascal) can be be entered or selected on the bar. (7) 11 equally log-spaced values of p0 range for each Locator {Mass,Radius} are available as 11 clickable buttons after "Click to set p0". The Minimum and Maximum values of p0 are the two extremes, corresponding to bi-layer, instead of tri-layer models. (8) Two dashed curves in the ternary diagram show 1-σ uncertainty boundary in composition-space due to the mass and radius measurement errors (δM+/-, δR+/-). The thick black curve in the ternary diagram instead show the degeneracy of tri-layer model due to the trade-off between the three substances, but not due to the mass or radius measurement uncertainties.
Any questions, comments, or suggestions are very welcome, please feel free to email me astrozeng@gmail.com
★Alternatively, some analytical formulae can provide quick and approximate solutions for the interiors of rocky exoplanets:
Examples:
Download Plot in Postscript: Click Here. (update 2016/10)
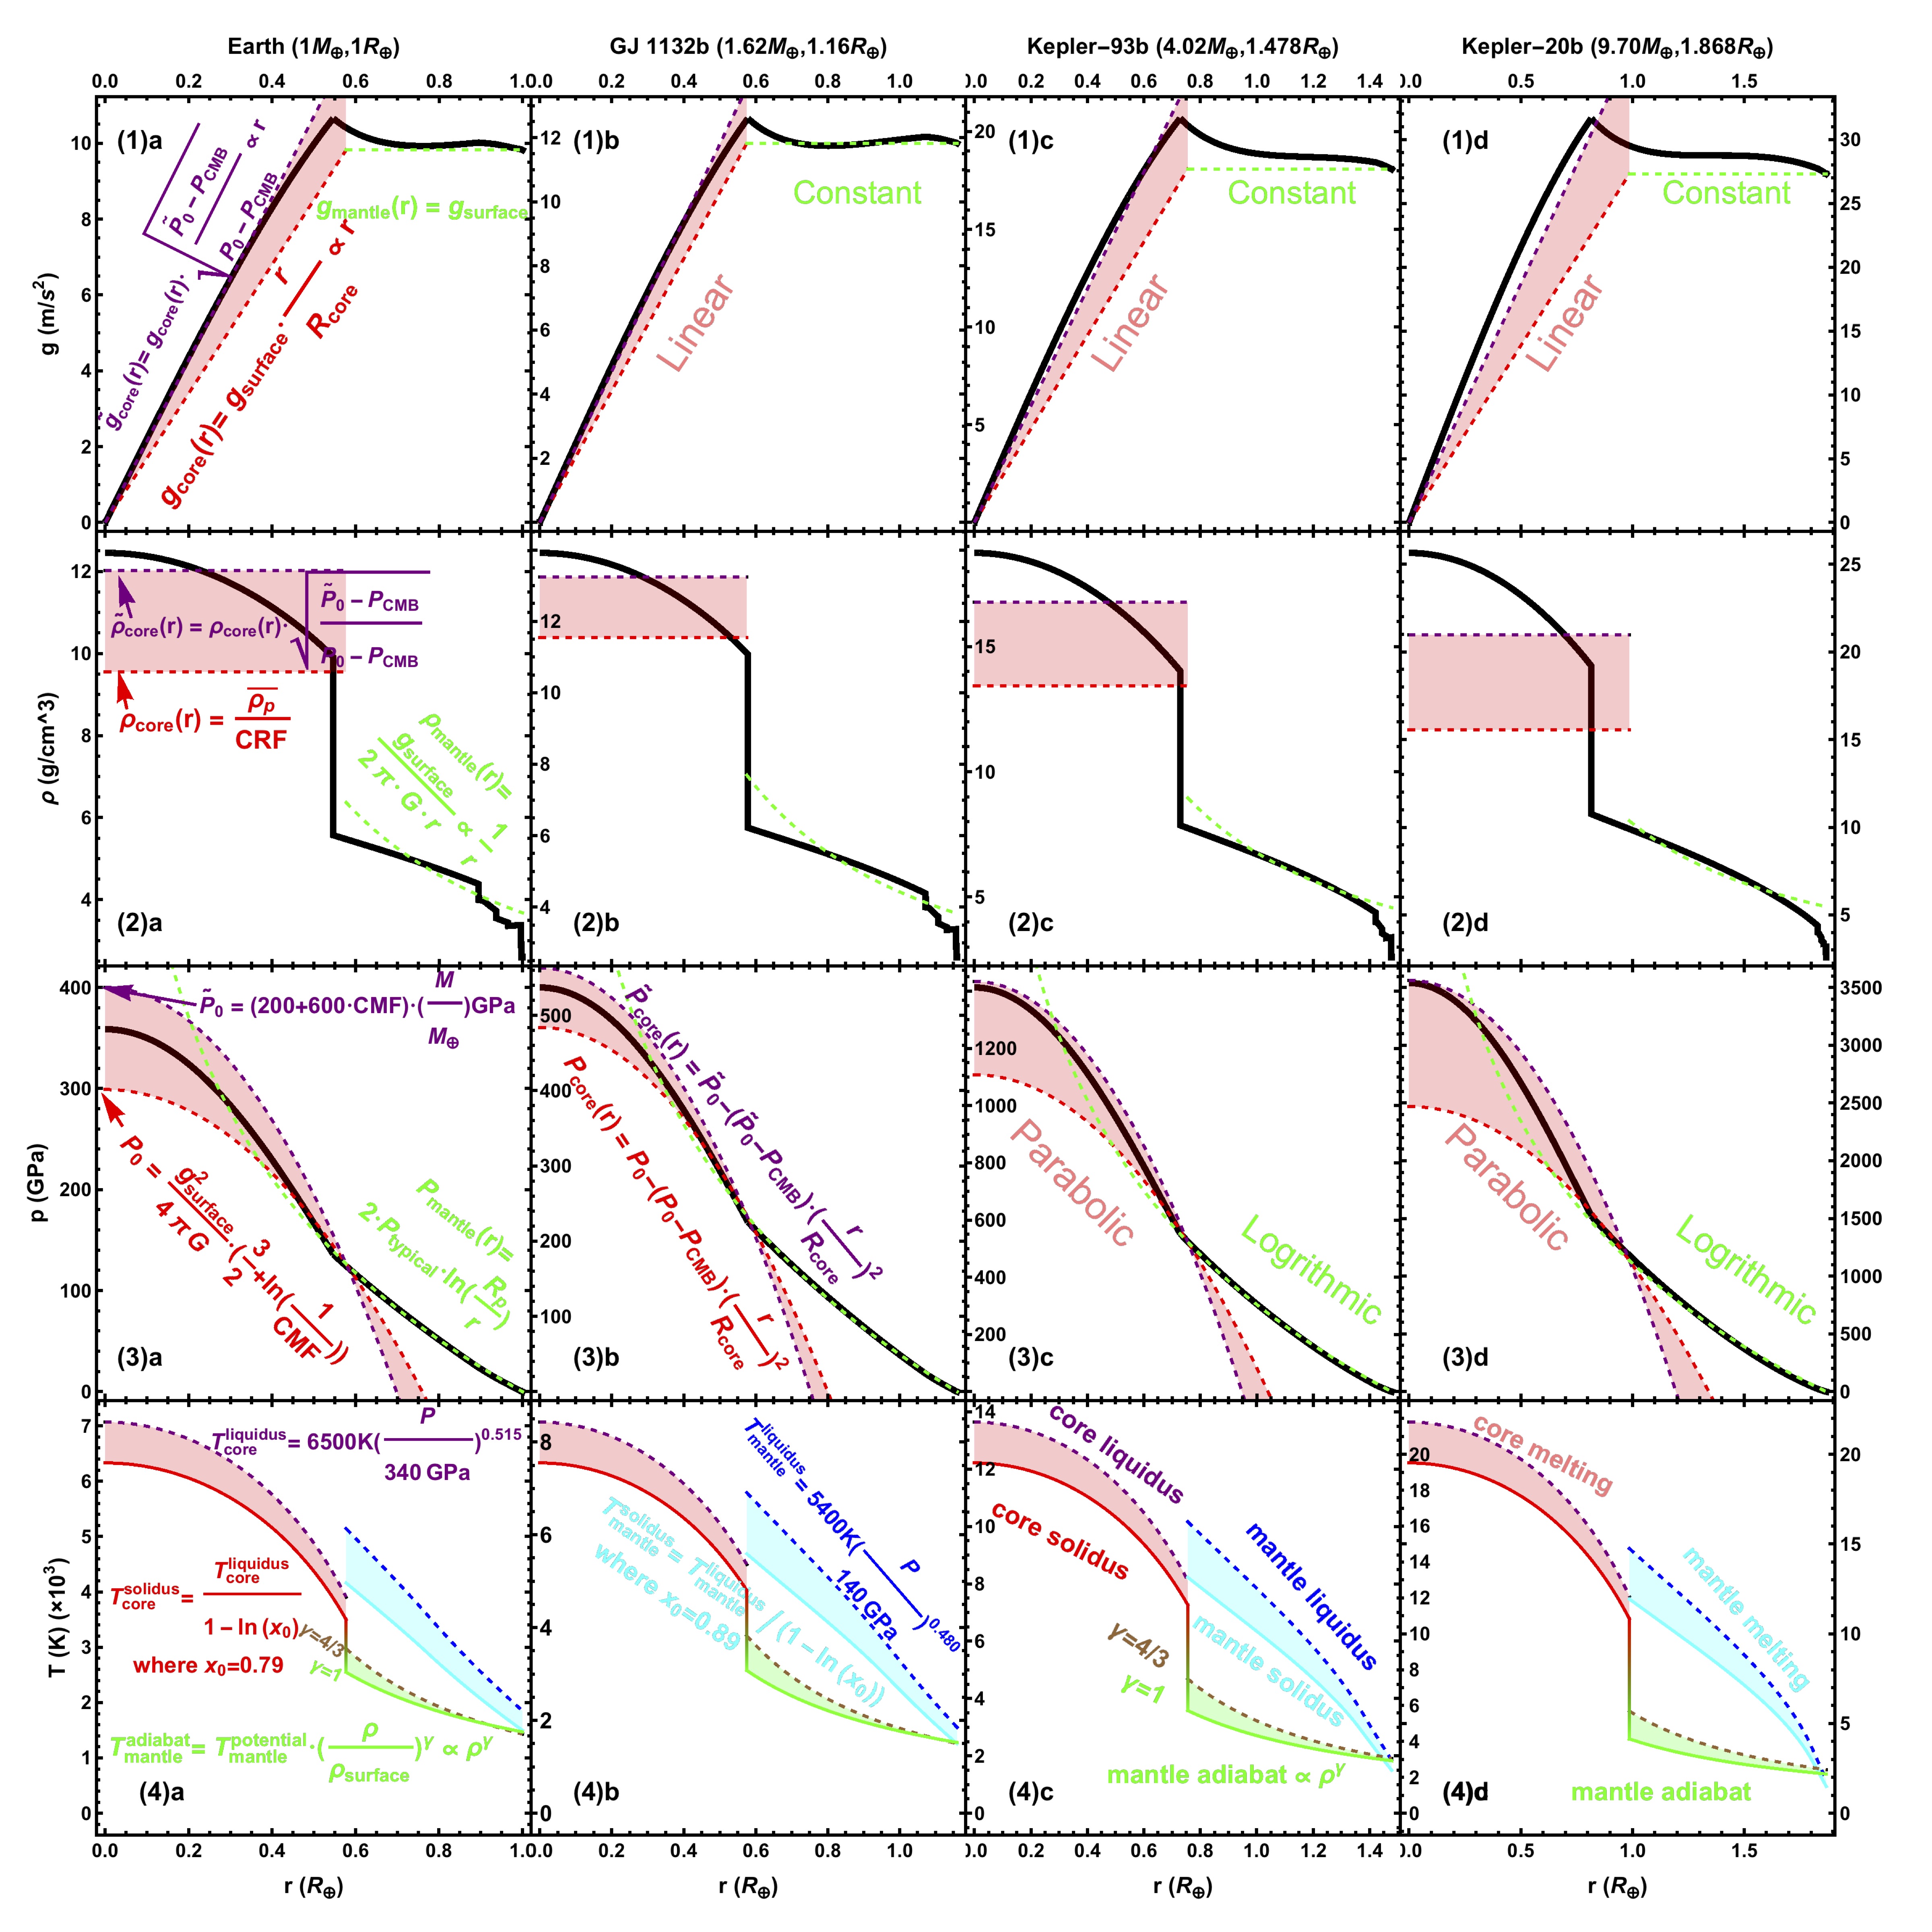
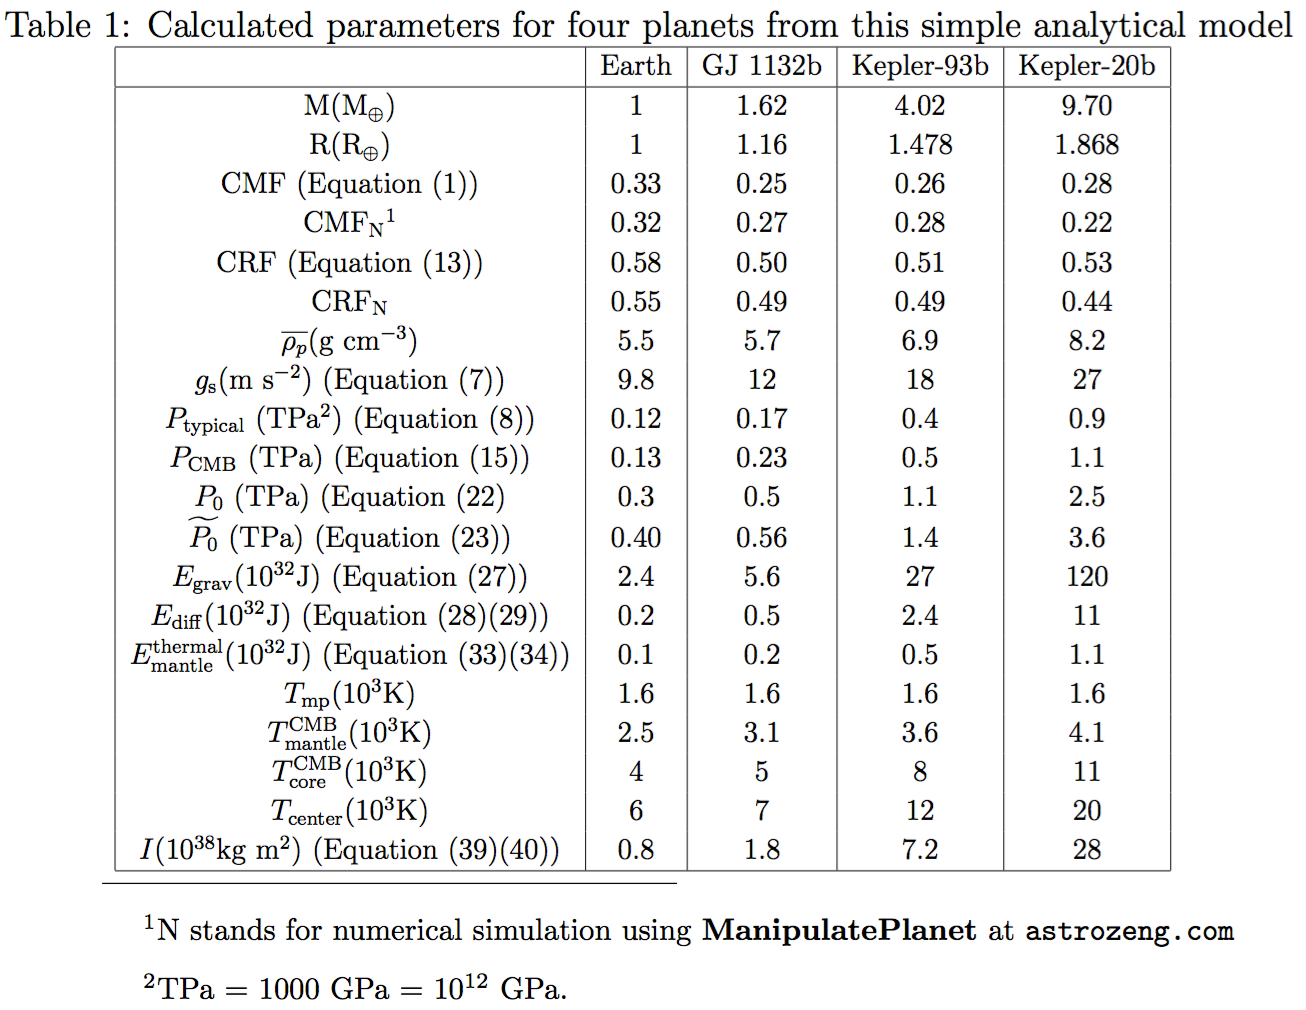
Note for the Analytical Model: Numerical calculations based on PREM-extrapolated EOS (black) versus simple analytical models: Core (red, purple, and pink-area in between) and Mantle (green). Panel (1-4)a: Earth, Panel (1-4)b: GJ 1132b, Panel (1-4)c: Kepler-93b, Panel (1-4)d: Kepler-20b. Panel (1)a-d: Gravity Profiles (core is proportional to r and mantle is constant). Panel (2)a-d: Density Profiles (core is constant and mantle is inversely proportional to r). Panel (3)a-d: Pressure Profiles (core is parabolic in r and mantle is logarithmic in r). Panel (4)a-d: Temperature Profiles (best estimates shall lie in the green area (mantle) and pink area (core)). The solidus (where mixture starts to melt) and liquidus (where mixture completely melts) are plotted for comparison. The temperature profiles are calculated based on the scheme from (Stixrude 2014 (PDF)).
Characteristic parameters of planets above:
References:
(1) “A Simple Analytical Model for Rocky Planet Interior”. Li Zeng, and Stein B. Jacobsen. ApJ, 837, 164, 2017. (ADS link) (PDF, updated) (PDF)
(2) “Variational Principle for Planetary Interiors”. Li Zeng, and Stein B. Jacobsen. ApJ, 829, 18, 2016. (ADS link) (PDF)
Any questions, comments, or suggestions are very welcome, please feel free to email me astrozeng@gmail.com
★Preliminart Study of the Phase Diagram of H2O together with the discovery of some Kepler planets suggest the possible existence of H2O-rich planets. With thermal evolution, some of them may have super-ionic phase of H2O in their deep interior (the phase transition from ionic fluid H2O to super-ionic solid H2O occurs typically on the order of a few 10's GPa or ~100 GPa level, equivalent to the core-mantle-boundary pressure on Earth).
Examples:
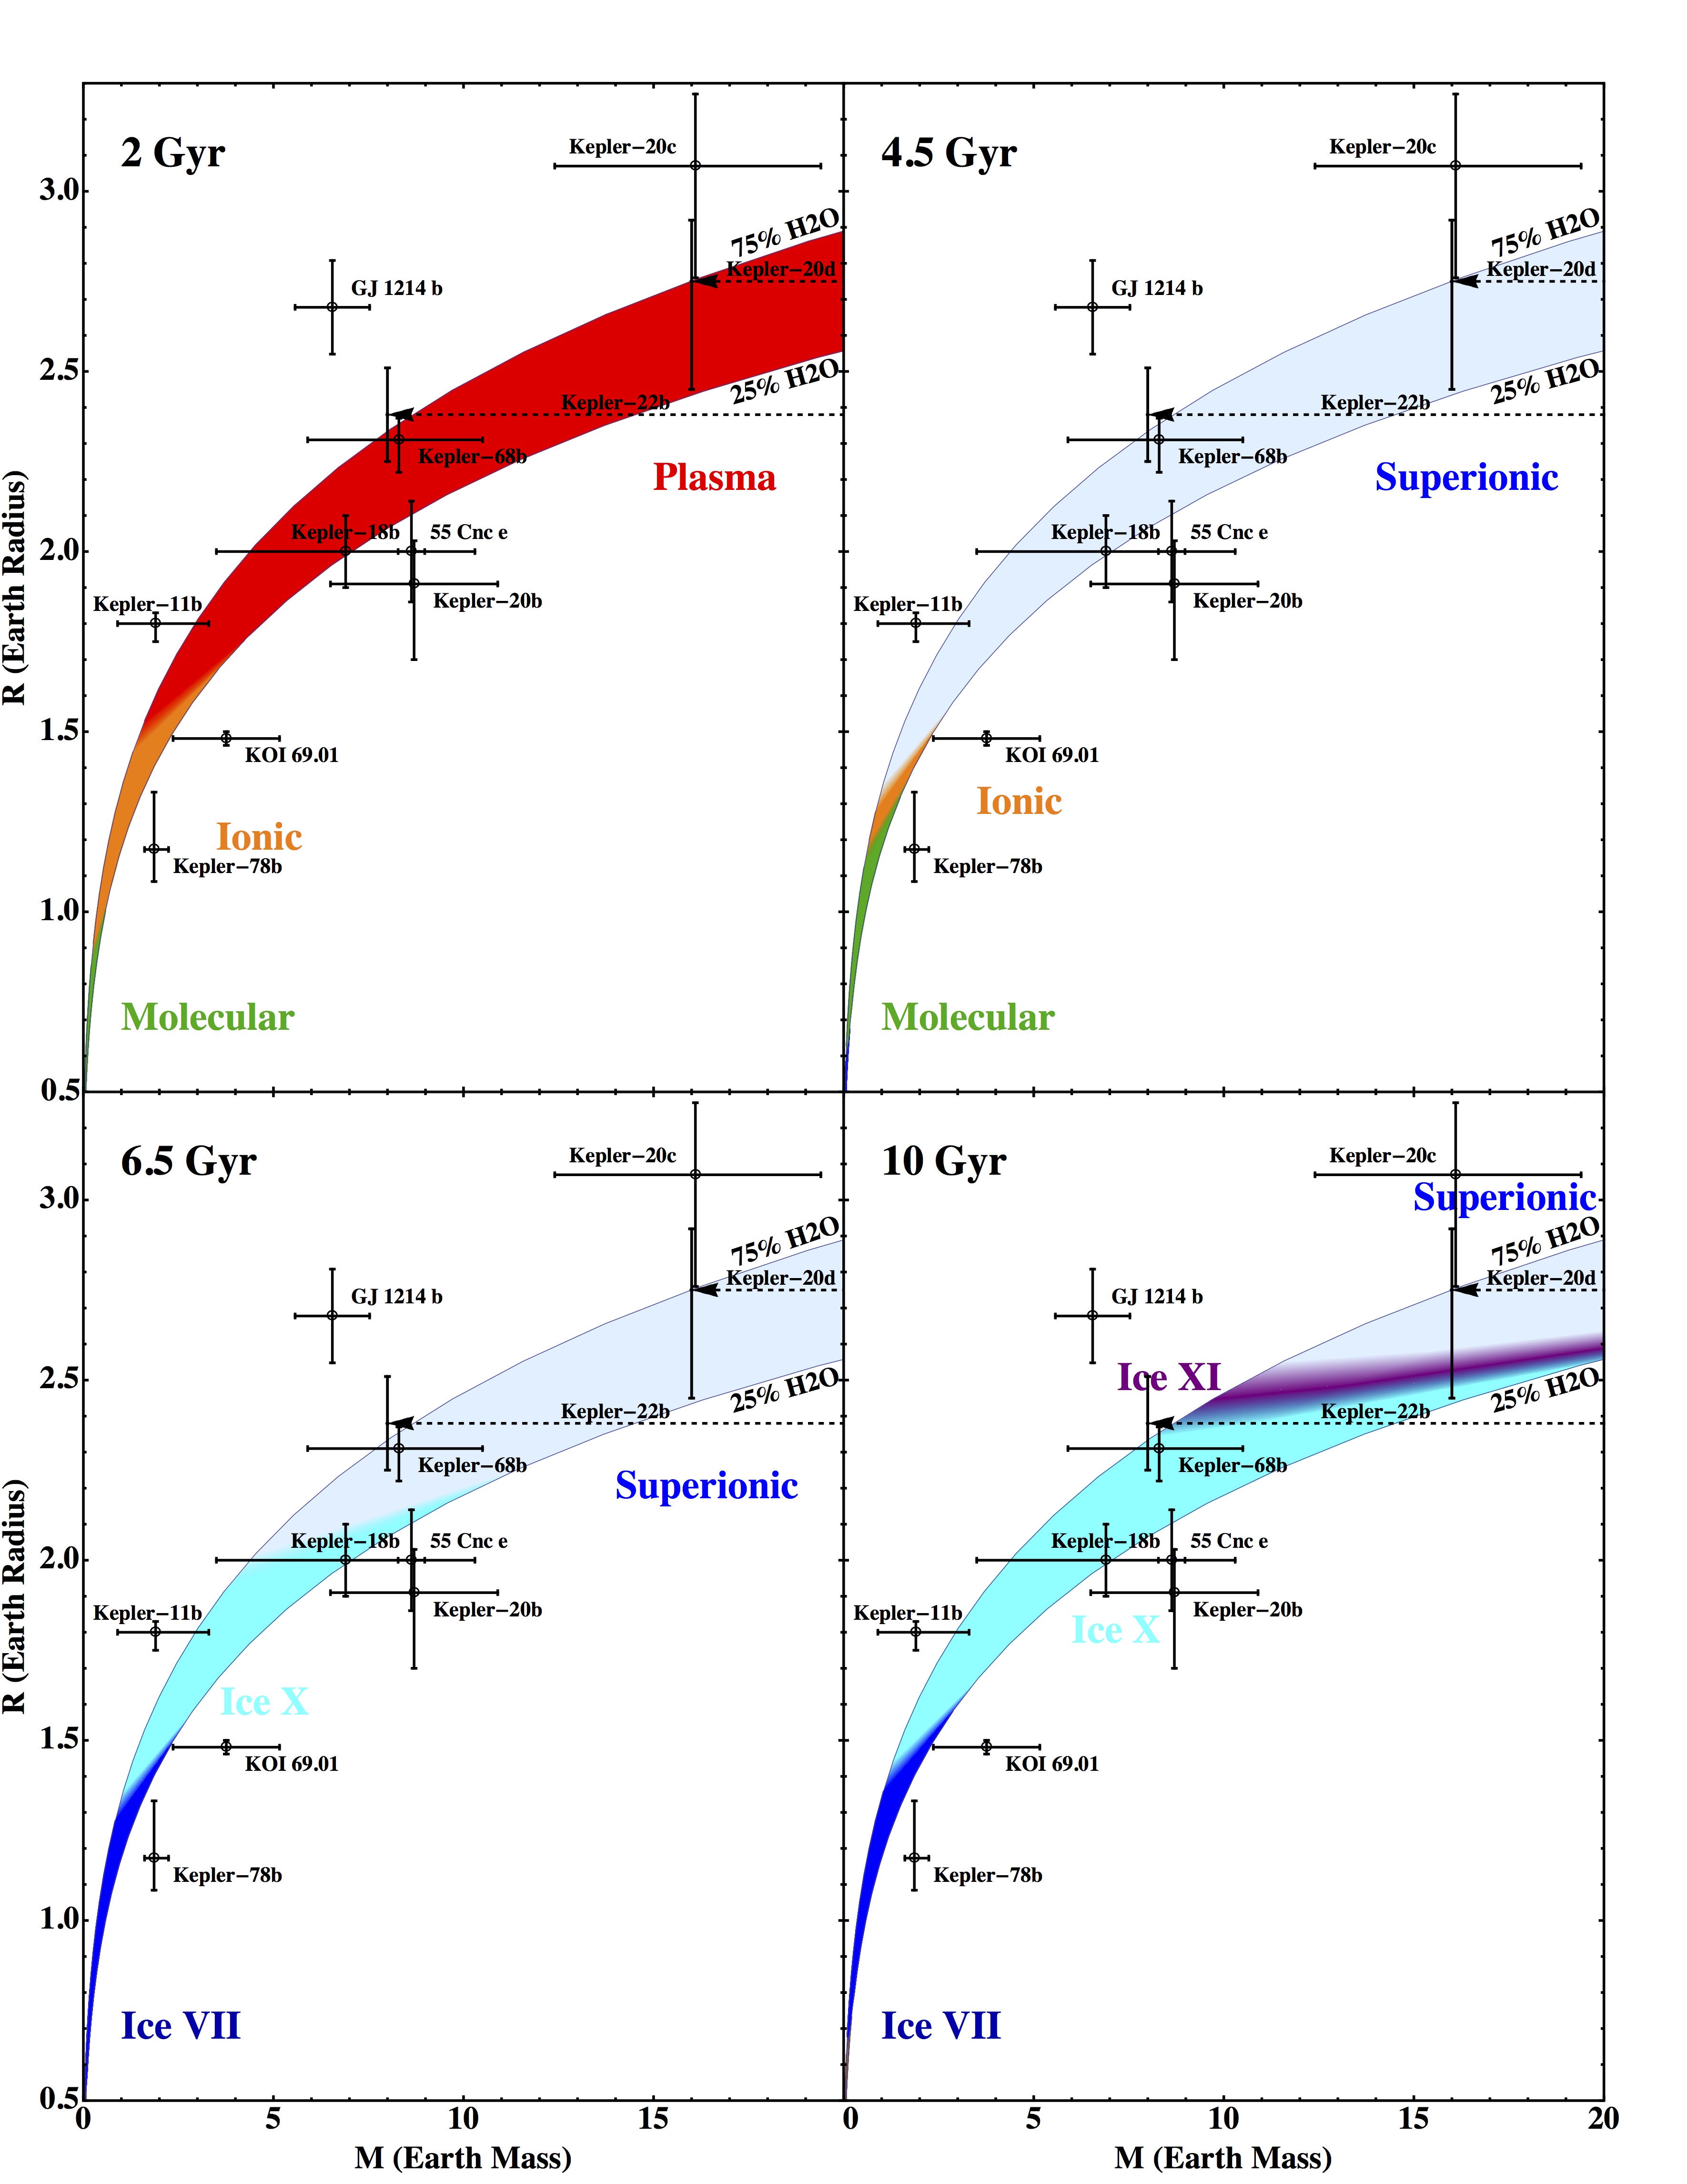
Download Plot in PDF: Click Here. (updated 2014/03)
Note: H2O Equation of States (EOS) adopted here include the following solid phases:
Ice Ih, Ice III, Ice V, Ice VI (Chaplin's website), Ice VII (Frank et al. 2004 (PDF)), Ice X (French et al. 2009 (PDF)), Molecular Fluid, Ionic Fluid, Plasma, and Super-ionic (Cavazzoni et al. 1999 (PDF), Redmer et al. 2011 (PDF), French & Redmer 2015 (PDF), French et al. 2016 (PDF), Hernandez & Caracas 2016 (PDF)).
The possibility of water-rich planets in our galaxy results from both the mass-radius measurements of some exoplanets and our understanding of cosmo-chemistry. Some of them may consist of ~50 percent water by weight, much more than what Earth has. Our research suggests that water in the deep interiors of these planets would inevitably undergo a fluid-solid phase transition at around a few 10's GPa or ~100 GPa level, equivalent to the core-mantle-boundary pressure on Earth. This solid phase, termed "super-ionic" (wikipedia link)(quanta link), however, has the property of both a solid and a liquid, where the oxygen atoms are fixed in a crystal lattice while the hydrogen ions (protons) are somewhat delocalized and mobile. The mobile protons result in its capability to conduct electricity.
References:
(1) “The Effect of Temperature Evolution on the Interior Structure of H2O-rich Planets”. Li Zeng and Dimitar D. Sasselov. ApJ, 784, 96, 2014. (ADS link) (PDF)
Any questions, comments, or suggestions are very welcome, please feel free to email me astrozeng@gmail.com
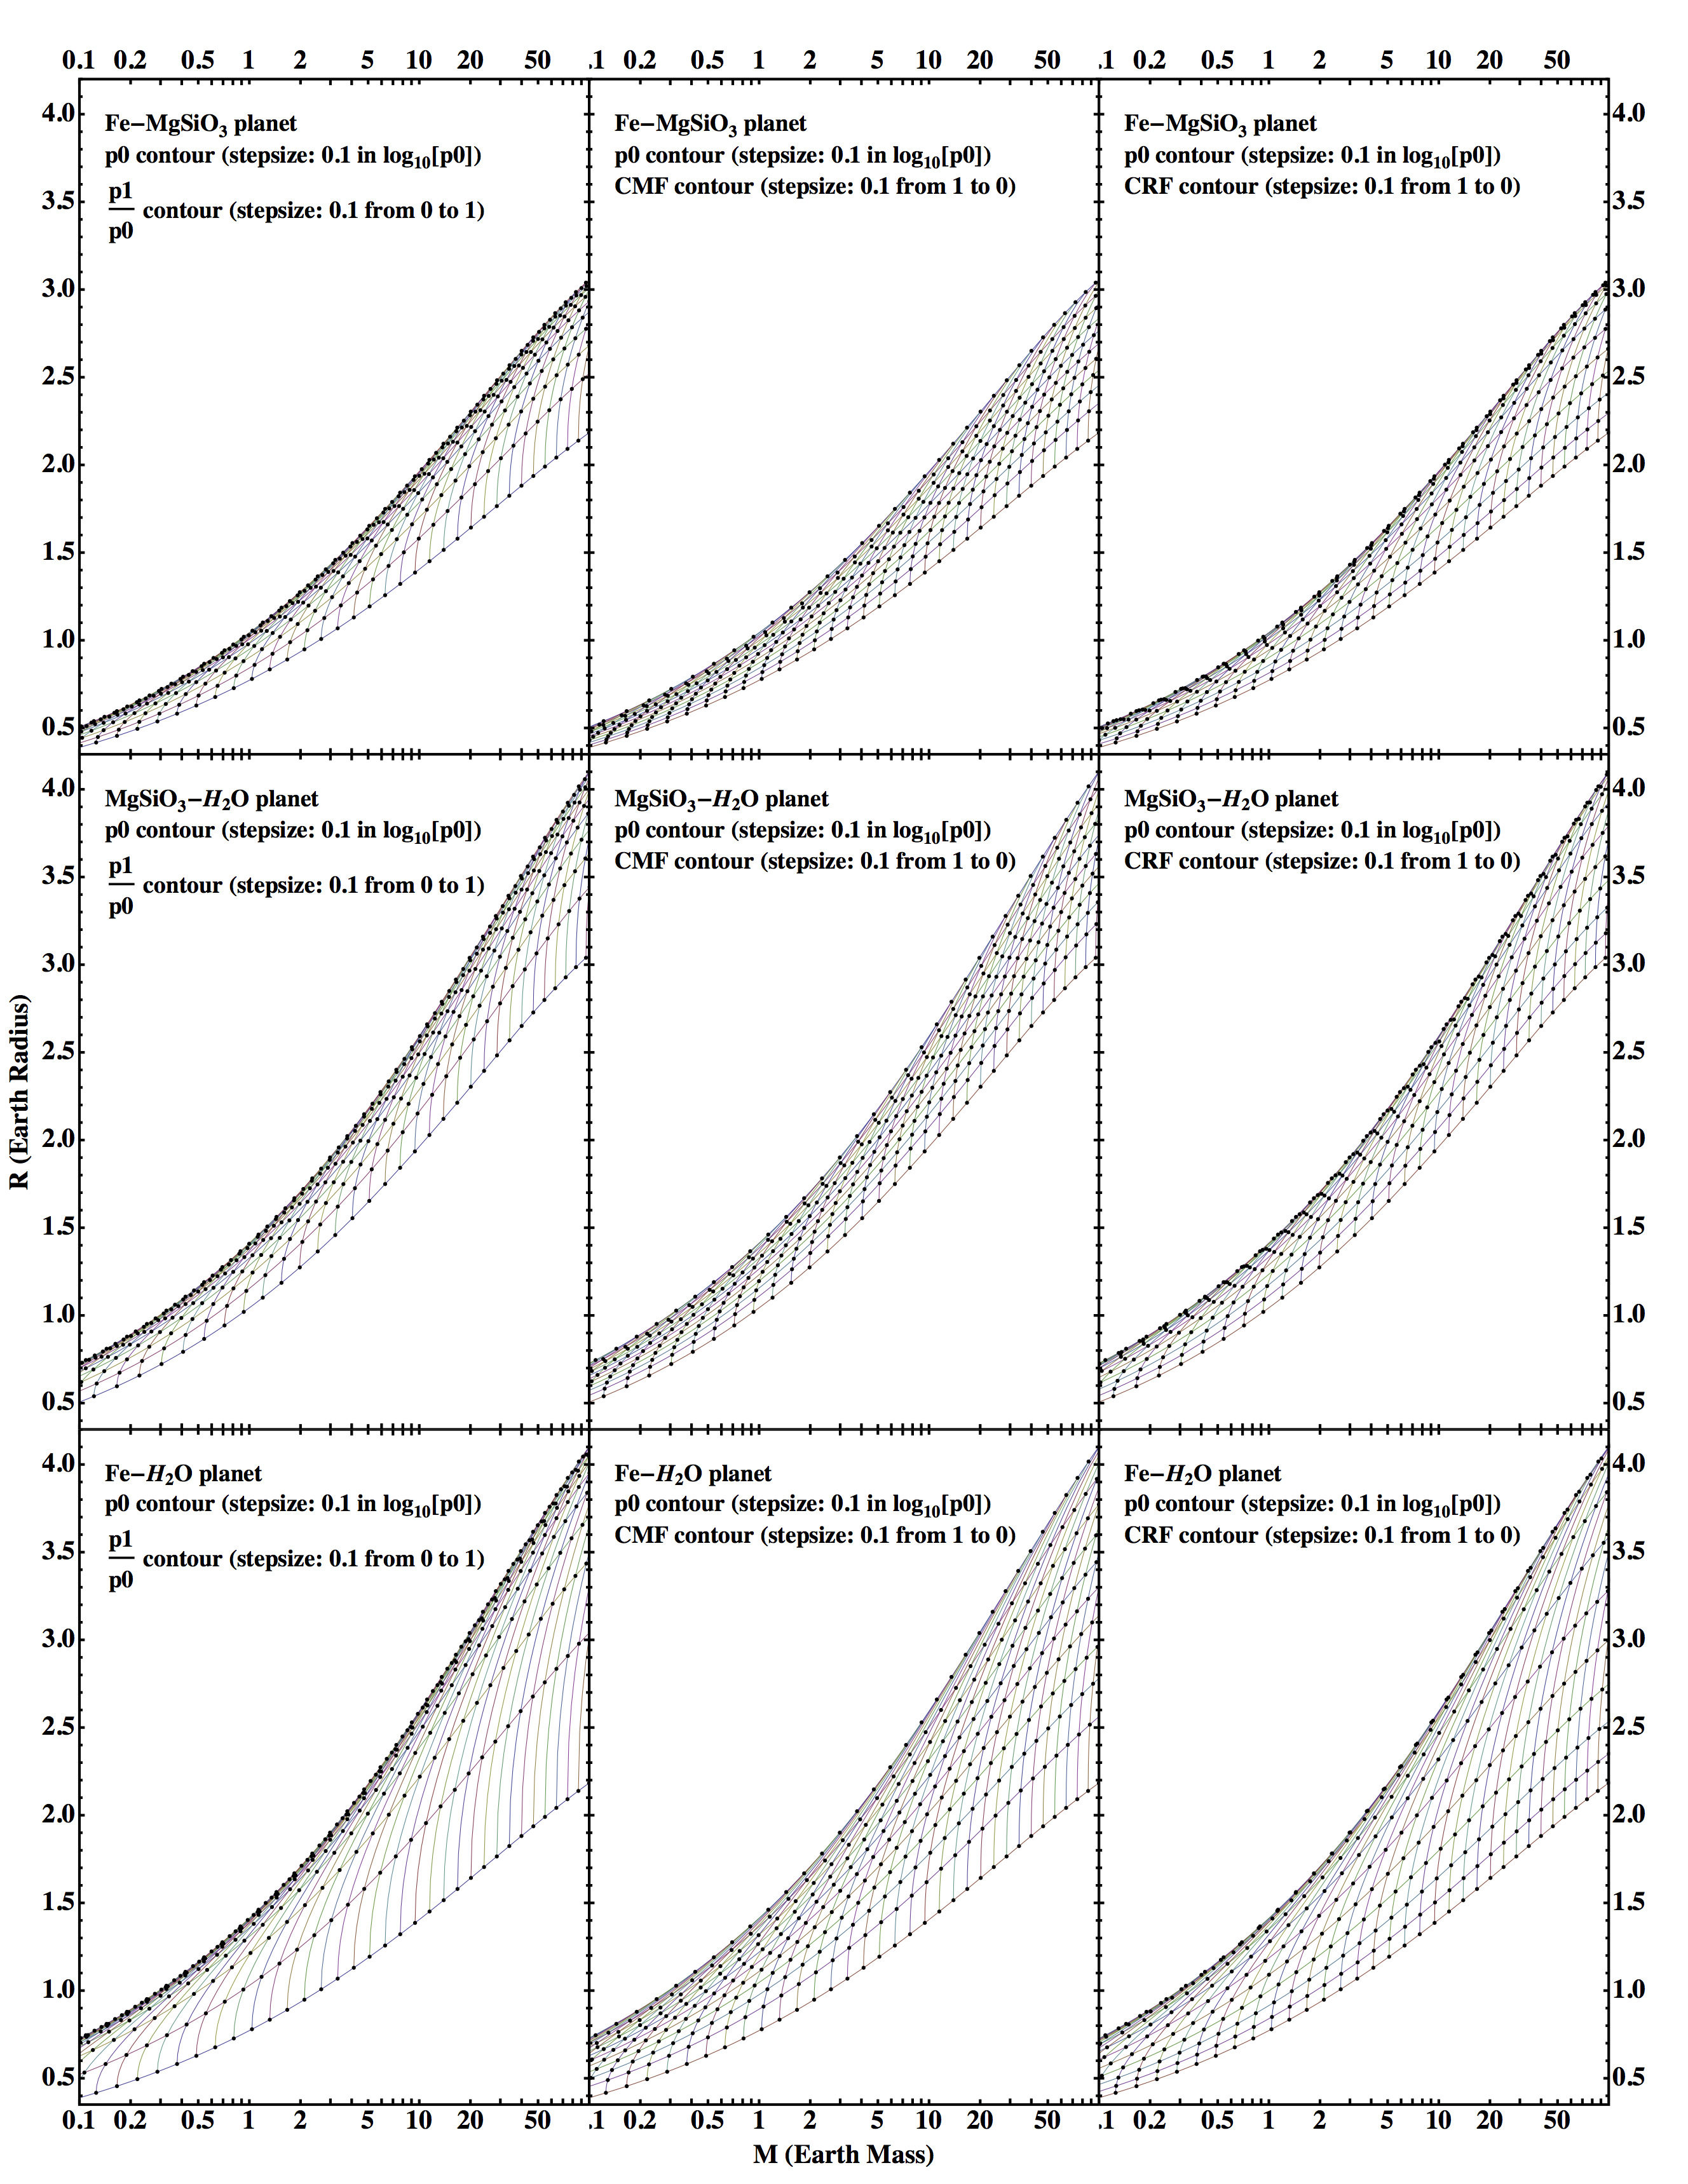
★Mass-radius Mesh:
Theoretical contours of pressure, pressure ratio, core mass fraction (CMF), and core radius fraction (CRF) of planets for any two-layer model. The mesh illustrates the relation between the interior structure and the mass-radius of a planet, thus, can be used for interpolation and solving the inverse problem.
Examples:
Download Data of Mesh/Contours in Excel:
Fe-MgSiO3 planet:
MgSiO3-H2O planet:
Fe-H2O planet:
References:
(1) “A Detailed Model Grid for Solid Planets from 0.1 through 100 Earth Masses”. Li Zeng and Dimitar D. Sasselov. PASP, 125, 227, 2013. (ADS link) (PDF)
Note for Mass-Radius Mesh of Bi-Layer Planet Model:
1. x-axis is in unit of Earth Masses in logarithmic scale. y-axis is in unit of Earth Radii in linear scale. 1st row: Fe-MgSiO3 planet. 2nd row: MgSiO3-H2O planet. 3rd row: Fe-H2O planet. 1st column: contour mesh of p1/p0 with p0. 2nd column: contour mesh of CMF with p0. 3rd column: contour mesh of CRF with p0.
2. Given mass and radius input, various sets of mass-radius contours can be used to quickly determine the characteristic interior parameters of a 2-layer planet, such as its p0 (central pressure, i.e., pressure at the center of the planet), p1/p0 (ratio of core-mantle boundary pressure over central pressure), CMF (core mass fraction), and CRF (core radius fraction).
3. Given a unique set of mass and radius, the solution of a 2-layer model is unique. It is represented as a point on the mass-radius diagram. This problem has two degrees of freedon, thus, given any pair of two parameters from the following list: M (mass), R (radius), p0, p1/p0, CMF, CRF, and so on, the solution is unique. The contours of constant M or R are trivial on the mass-radius diagram. They are simply vertical or horizontal lines. The contours of constant p0, p1/p0, CMF, or CRF are generally curves, but can sometimes be approximated as straight lines in certain regions.
4. Within any pair of two parameters, by fixing one of them and continuously varying the other, the point on the mass-radius diagram will move to form a curve. This is how the contour curves are formed. Multiple values of the fixed parameter will give multiple parallel curves, forming one set of contours. The other set of contours can be obtained by switching the fixed parameter with the varying parameter.
The two sets of contours criss-cross each other to form a mesh, which is a natural coordinate system (see the plot above) of this pair of parameters, superimposed onto the existing Cartesian (M,R) coordinates of the mass-radius diagram. This mesh can be used to solve for the two parameters given the mass and radius input, and vice versa. Thus, it is useful for solving the inverse problem.
5. The data for the mass-radius contours with a finer grid are given in xls files. Each file contains two Excel sheets, one for mass and one for radius, both in Earth units. The rows of the table correspond to Log10[ p0 (Pa) ] from 8 to 14.4 with stepsize 0.025. The column of the table corresponds to one of the three parameters: p1/p0, CMF, or CRF from 0 to 1 in stepsize of 0.025.
6. The data can be used to translate a certain probability distribution in the mass-radius phase space, into the probability distribution of the interior structure parameter phase space, such as the probability distribution in p0-p1/p0 phase space, p0-CMF phase space, or p0-CRF phase space.
7. Regarding the Equation of States (EOS) used for this model: (1) Core is assumed to be solid pure ε-Fe (hexagonal close-packed phase of iron stable only at very high pressure). Due to impurities and partially molten state, the actual densities of planetary cores are likely lower. Thus, it might have over-estimated the densities of the core. (2) Mg-silicates are assumed to be solid MgSiO3 (perovskite, post-perovskite, and its higher-pressure derivatives). This is the major composition of Earth's lower mantle, however, the Earth's upper mantle (composed of various phases of Mg2SiO4) is less dense. Thus, it might have over-estimated the densities of the mantle. Considering all these, this model might have under-estimated the CMF by ~0.1 in some cases. (3) H2O is assumed to be in solid phase (Ice Ih, Ice III, Ice V, Ice VI (Chaplin's website), Ice VII (Frank et al. 2004 (PDF)), Ice X (French et al. 2009 (PDF))) along its melting curve. (4) At extremely high pressure, modified Thomas-Fermi-Dirac EOS (Salpeter & Zapolsky 1967 (PDF), Zapolsky & Salpeter 1969 (PDF)) is assumed for all components.
Any questions, comments, or suggestions are very welcome, please feel free to email me astrozeng@gmail.com
Matlab Exoplanet Code for Download (2008)
★Matlab codes for calculating the interior structure of exoplanets constructed under the guidance of Prof. Sara Seager.
Assumptions: Tri-layer planet: an iron core, a silicate mantle and a water layer. Temperature dependence of the Equation of State (EOS) is neglected for simplicity.
.png)
★Two matlab codes are provided below
Code instructions: (1) Download the code zip files and decompress them. (2) Please put the decompressed files into your Matlab work directory so that the Matlab can recognize them. (3) Use addpath command if necessary.
Solve the Differential Equation (DE) directly, thus, it takes longer to run, but more precise in calculation. This code can deal with zero uncertainty in planet mass and radius. It plots 1-σ, 2-σ, and 3-σ contours of given mass, radius, and uncertainties inputs. Example: for Mass=10 Earth Mass , Mass uncertainty=0.5 Earth Mass; Radius= 2 Earth Radius, Radius uncertainty= 0.1 Earth Radius: Type ExoterDE(10, 0.5, 2, 0.1); in your Matlab command window. Then hit Enter.
Solve the Differential Equation by interpolation of an already-constructed data grid based on Equations of State (EOS) supplied, thus, it runs faster, but less precise.This code plots a colormap showing the possible proportions of iron, silicate and water for a continuous range of σ from 0 up to 3. Example: for Mass=10 Earth Mass , Mass uncertainty=0.5 Earth Mass; Radius= 2 Earth Radius, Radius uncertainty= 0.1 Earth Radius: Type ExoterDB(10, 0.5, 2, 0.1); in your Matlab command window. Then hit Enter.
Note on Equation of States (EOS): This model adopts the EOS from Seager et al. 2007 (PDF). (1) Core is assumed to be solid pure ε-Fe (hexagonal close-packed phase of iron stable only at very high pressure). Due to impurities and partially molten state, the actual densities of planetary cores are likely lower. Thus, it might have over-estimated the densities of the core. (2) Mg-silicates are assumed to be solid MgSiO3 (perovskite, however, it does not include phase transtion of perovskite to post-perovskite, and its further dissociation at higher pressure.). This is the major composition of Earth's lower mantle, however, the Earth's upper mantle (composed of various phases of Mg2SiO4) is less dense. Thus, it might have over-estimated the densities of the mantle, especially for small masses. Considering all these, this model might have under-estimated the CMF by ~0.1 in some cases. (3) H2O is assumed to be in cold solid phase (Ice VII, VIII, X).(4) At extremely high pressure, modified Thomas-Fermi-Dirac EOS (Salpeter & Zapolsky 1967 (PDF), Zapolsky & Salpeter 1969 (PDF)) is assumed for all components.
References:
(1) “A Computational Tool to Interpret the Bulk Composition of Solid Exoplanets based on Mass and Radius Measurements”. Li Zeng and Sara Seager. PASP, 120, 983, 2008. (ADS link) (PDF)
Any questions, comments, or suggestions are very welcome, please feel free to email me astrozeng@gmail.com