|
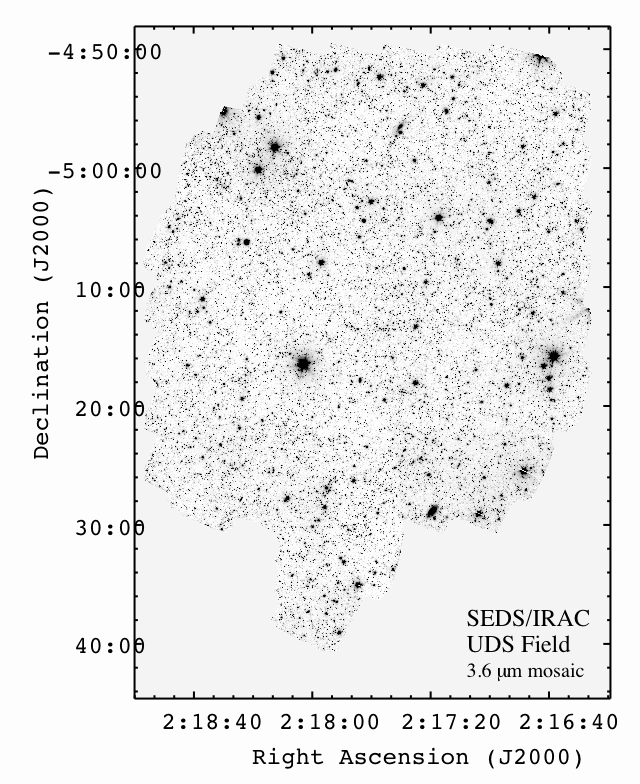
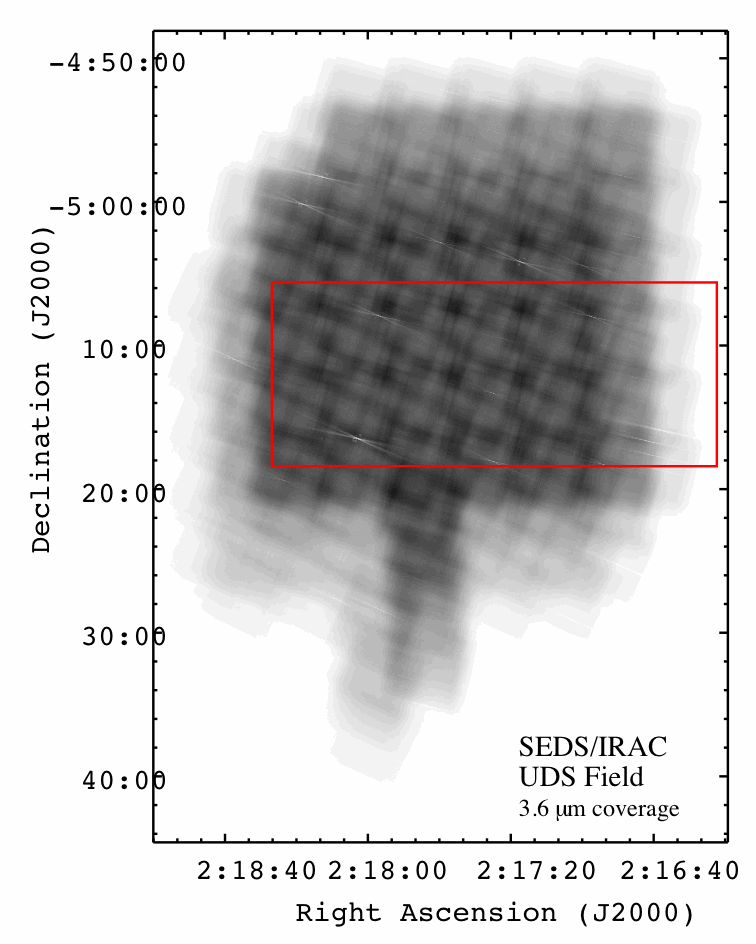
The UDS is the first of the five SEDS fields to be completed. Red below shows the approximate IRAC coverage. The area in the northeast corner was omitted because of the bright stars. The "peninsula" to the south was added to cover some z=6 Lyman-alpha emitters. The peninsula area should not be used for statistical studies related to z=6 because of the selection bias. UDS was observed in three epochs with approximate dates shown below. Click on the channels for coverage maps in FITS format. (These files are about 3.6 MB each at 3" resolution. You probably want to right click and save the files on your local machine.) For a ds9 region file showing the approximate coverage, click here. |
| Epoch 1 = 2009-09 | Epoch 2 = 2010-02 | Epoch 3 = 2010-09 | Total |
|---|---|---|---|
| ch1 = 3.6 μm | ch1 = 3.6 μm | ch1 = 3.6 μm | ch1 = 3.6 μm |
| ch2 = 4.5 μm | ch2 = 4.5 μm | ch2 = 4.5 μm | ch1 = 4.5 μm |

The following plot shows the 3.6 micron SEDS coverage of the UDS field, with the red rectangle indicating the HST (CANDELS Wide-field) coverage.

Return to SEDS Home Page