| Project Lead: | |
| Data Provision: |
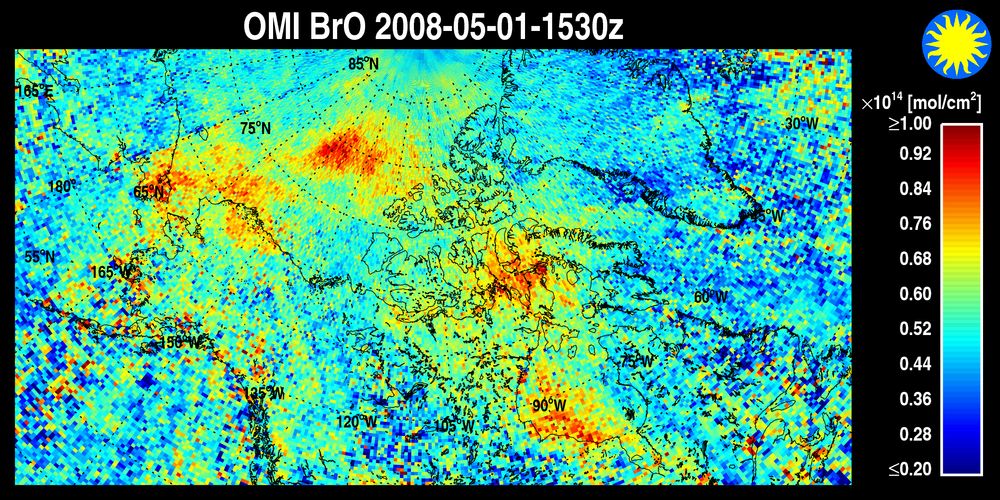
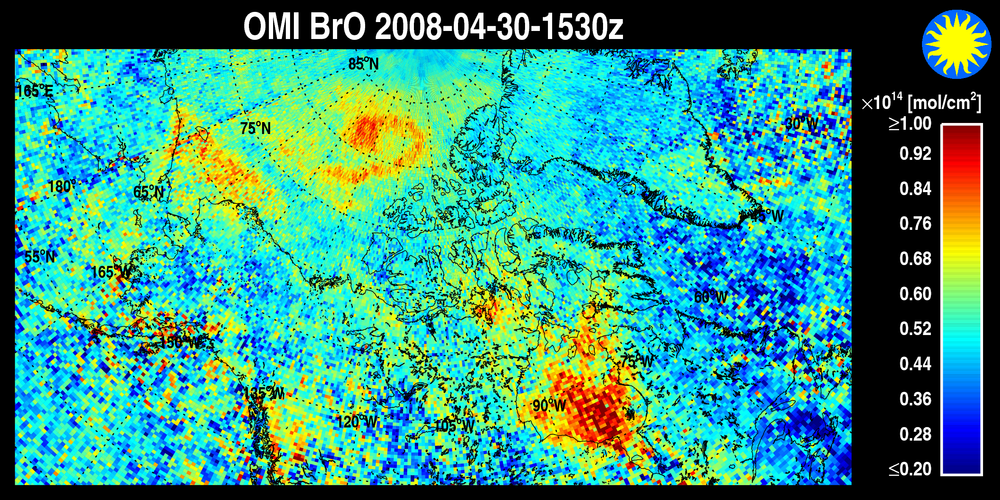
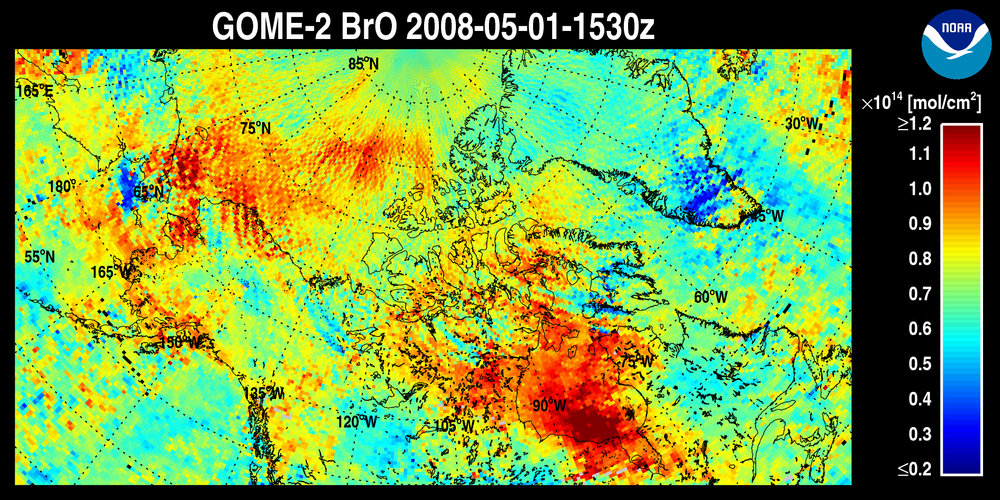
This page provides daily zoom images (55o
– 90oN, 180o – 40oW) of
bromine monoxide (BrO) observations by the OMI and GOME-2 satellite
instruments in support of the ARCTAS Spring2008 campaign. For each
instrument, a single image contains a map of the total column BrO
averaged over all data available within a 24h window before 15:30UTC
(11:30EST). Images for
the current and previous day are displayed on this page and
are updated daily. Older images can be found in the Zoom Image Directory.
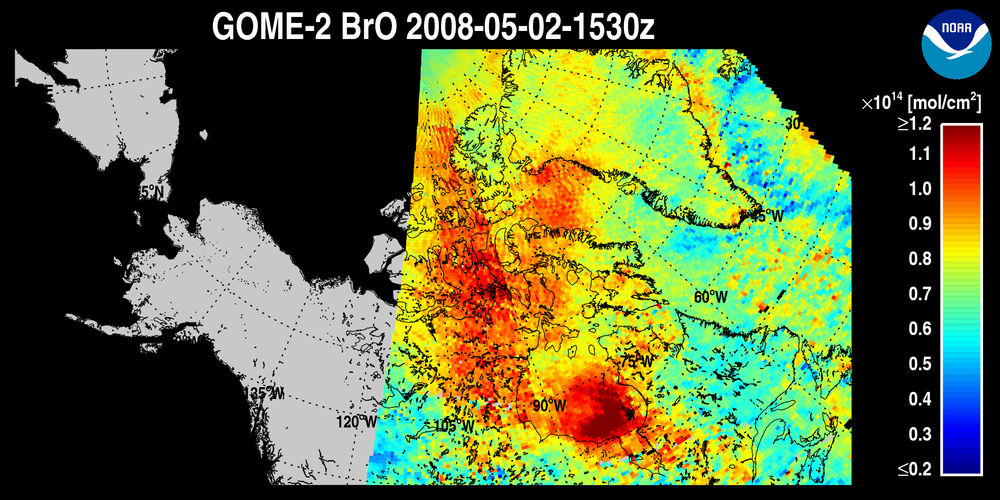
Unfilled/non-colored areas in the plots correspond to missing
data. These are present, most notably, in GOME-2 towards the equator,
since GOME-2 does not have the daily global coverage of OMI. Other
reasons for missing data may include limited availability of processed
BrO data within the last 24h, and the one-day-per-month spatial zoom
measurement mode of OMI (see for example 2008-03-18).
Caution:
Note that OMI and GOME-2 images are generated with different color
scales to account for the differences in dynamic
range of the BrO columns from the two instruments. Both data
sets are provided "as is", i.e., essentially unvalidated:
GOME-2 BrO is a fairly recent product from retrievals that
have been mirrored on the original GOME-1 approach, and OMI
data are provided in a new version (v1.9) that has yet to be
validated against correlative measurements. Neither data set
is as yet suitable for use in scientific publications.
Back to the main SAO ARCTAS support page
Back to the main SAO ARCTAS support page
Back to the main SAO ARCTAS support page