Atmospheric Measurements

Harvard-Smithsonian Center for Astrophysics


» Campaign Support
  • BROMEX 2012 Campaign
  • Fairbanks 2011 Campaign
  • » OMI Data Products
  • BrO
  • OC1O
  • HCHO
  • CHOCHO

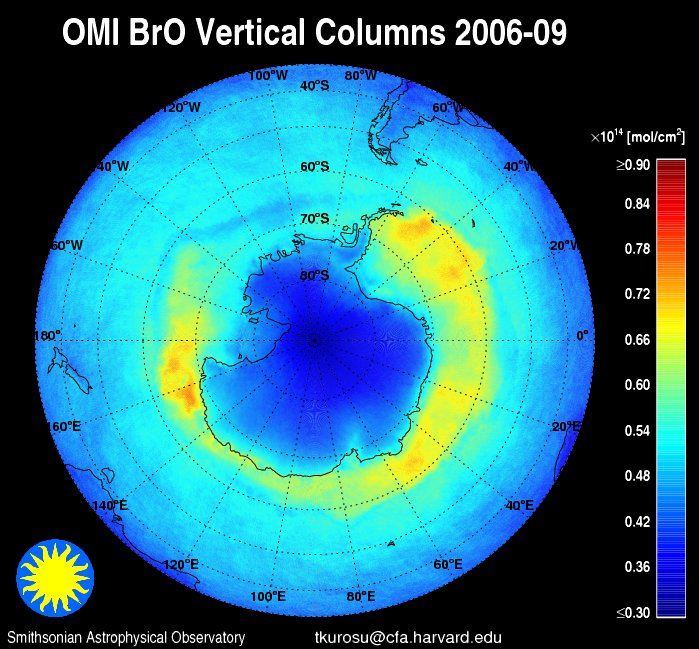
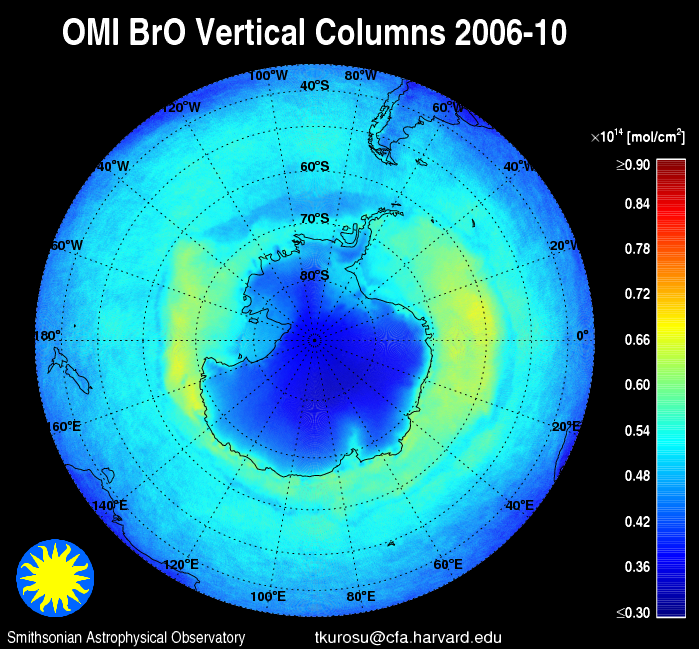
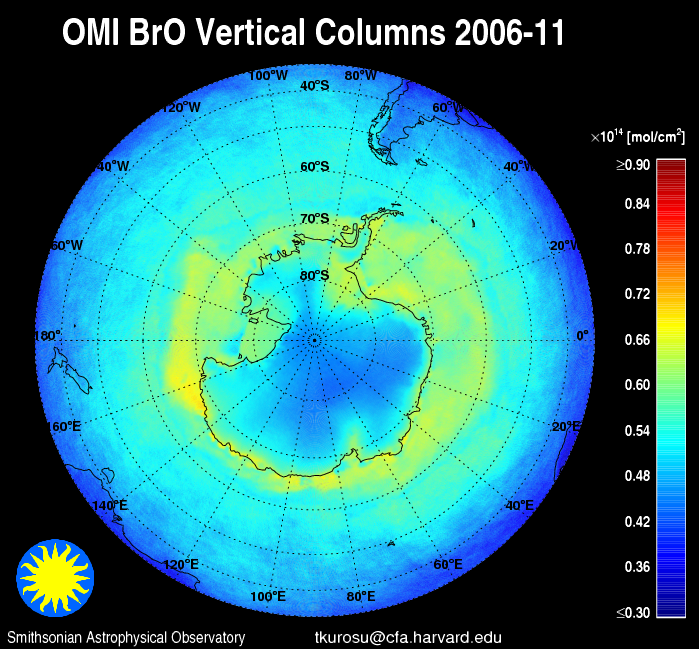
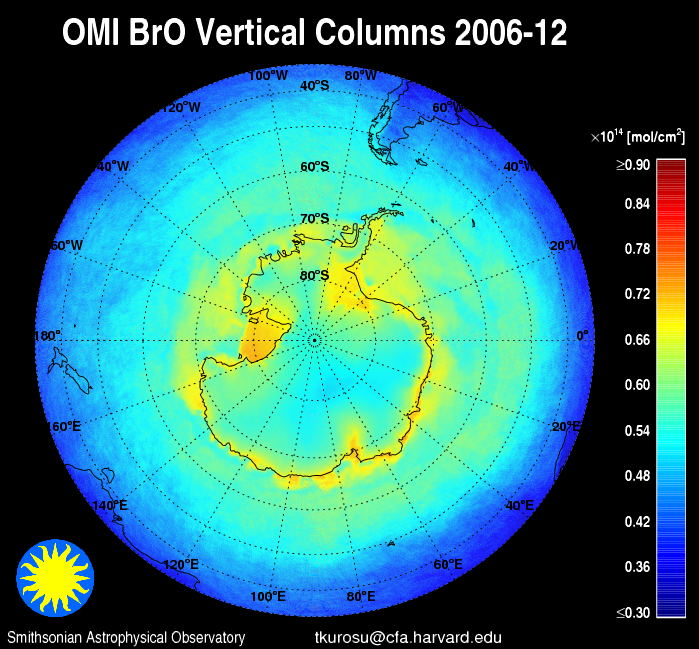
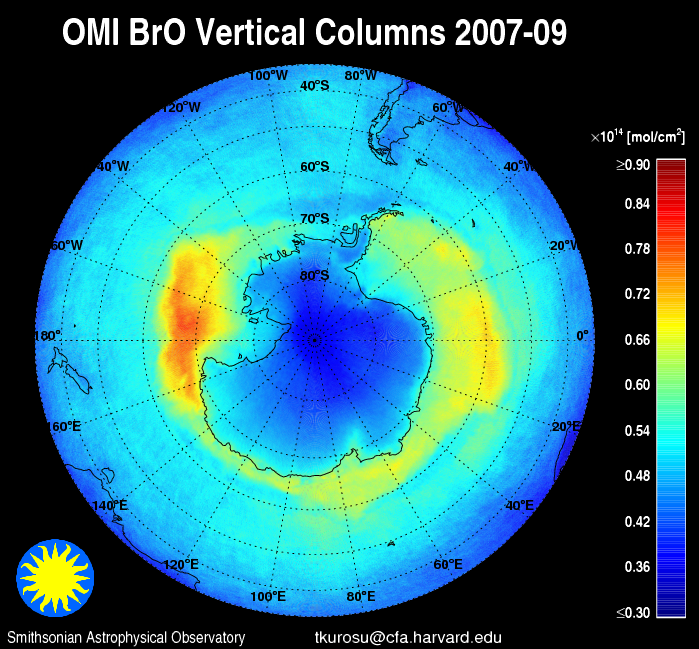
  • OMI - Sample Images (Bromine Monoxide (BrO) - Northern Hemisphere)

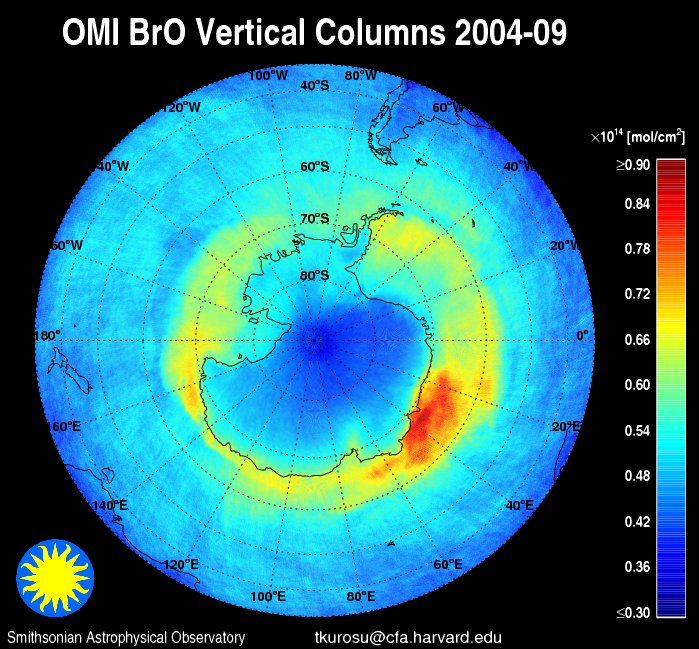
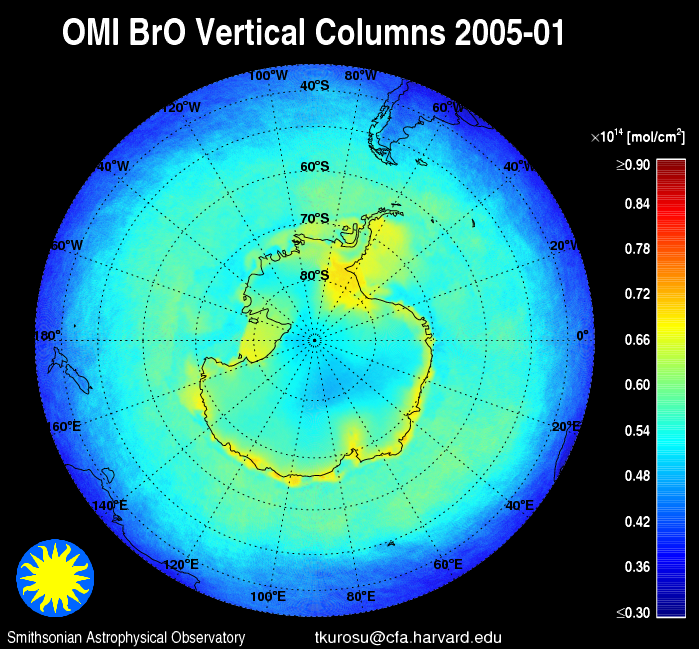
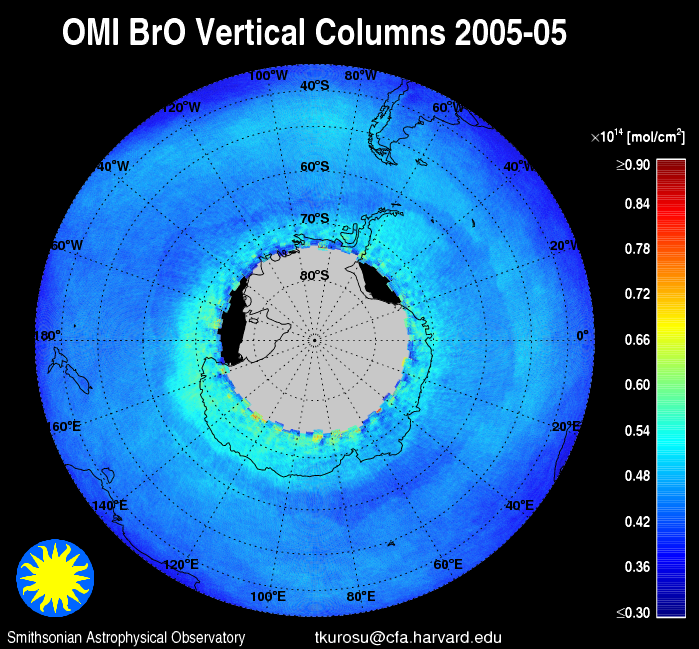
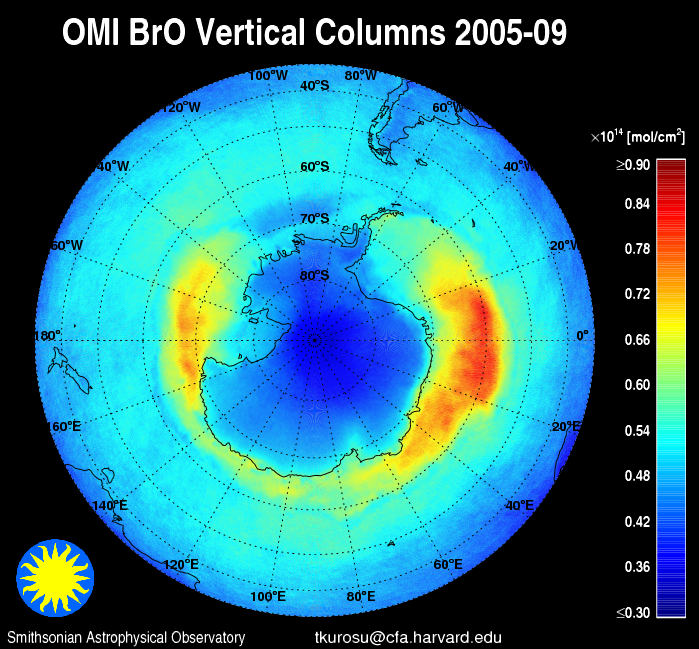
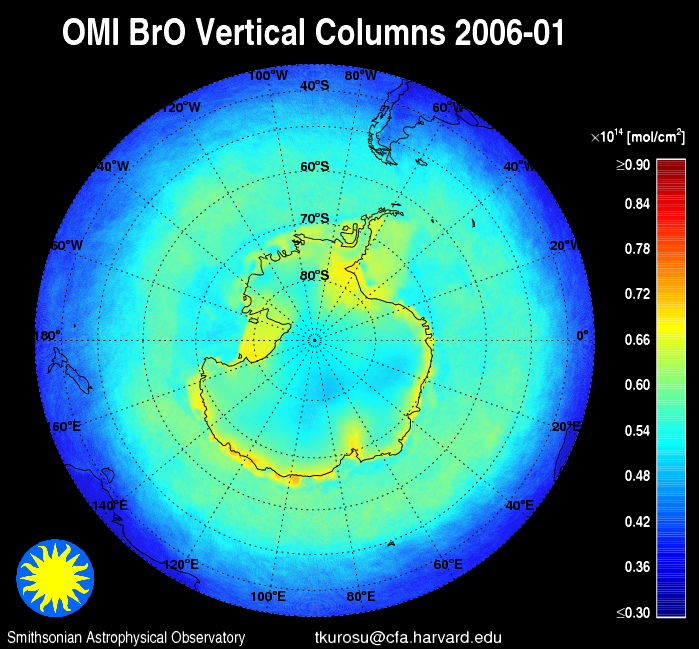
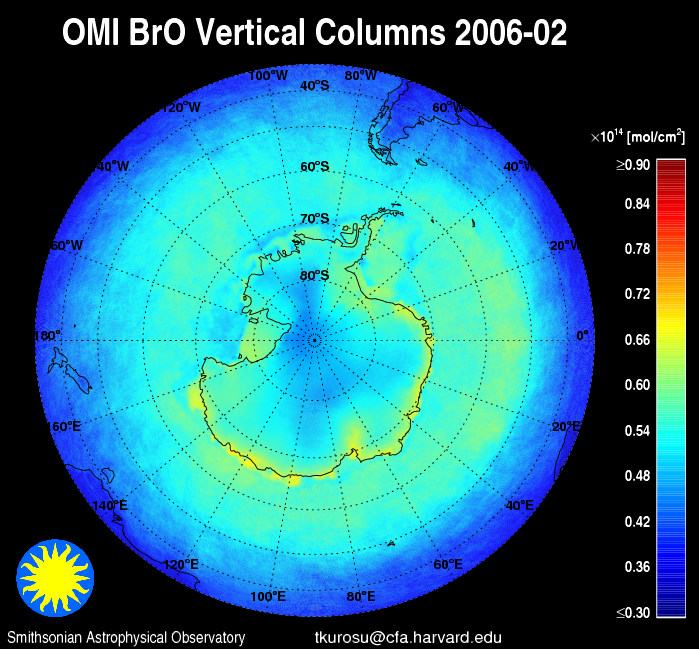
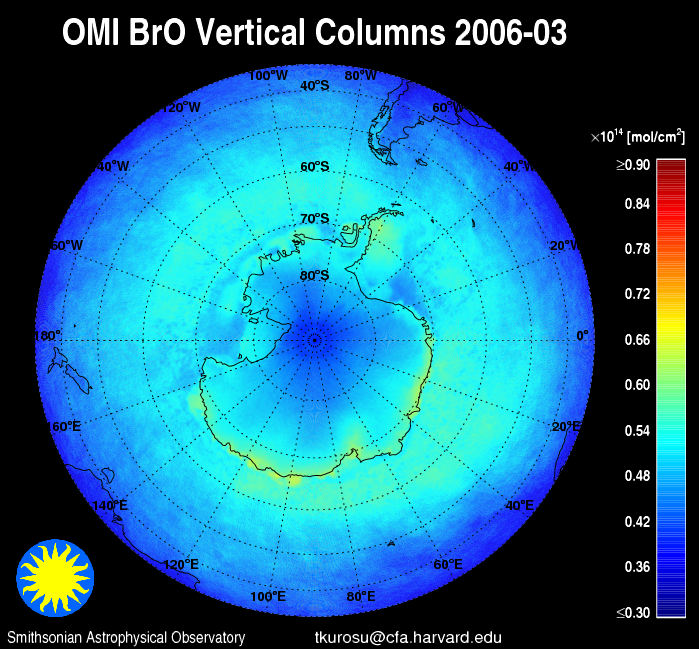
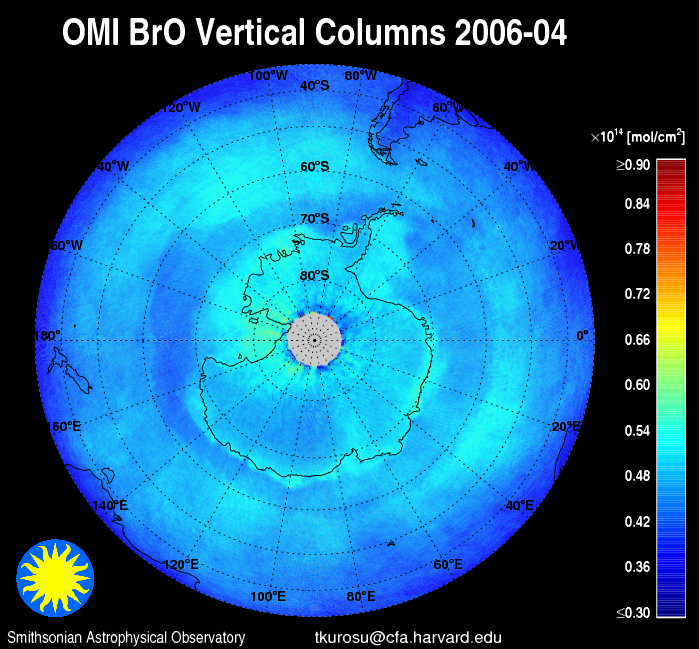
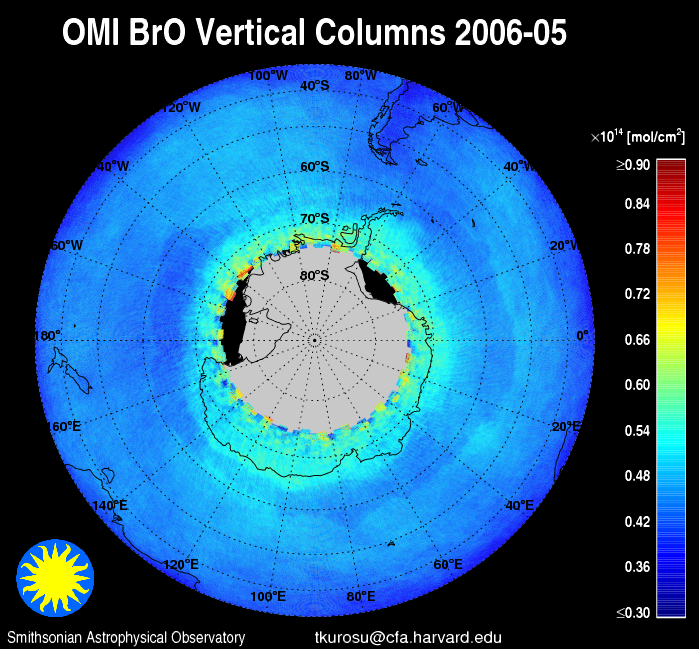
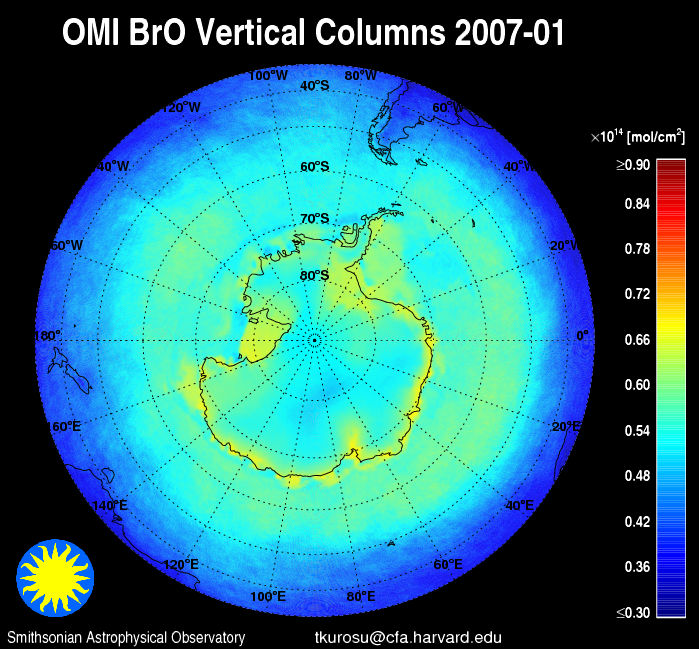
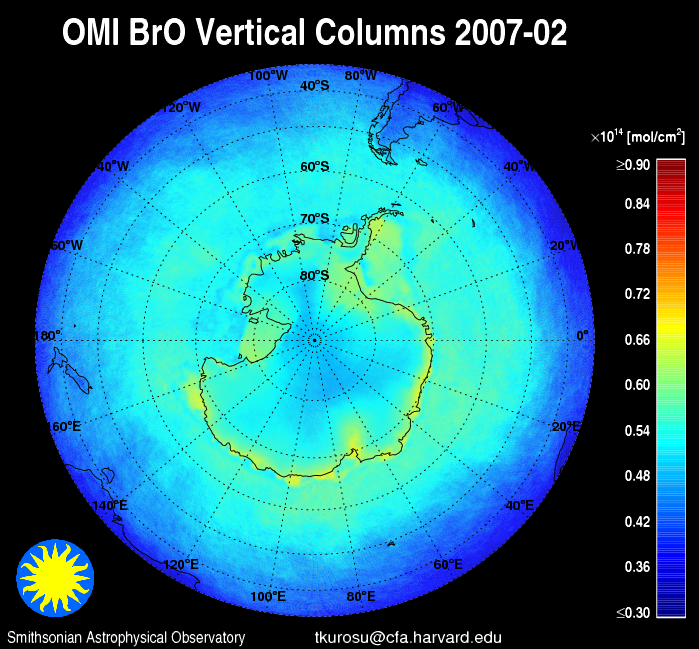
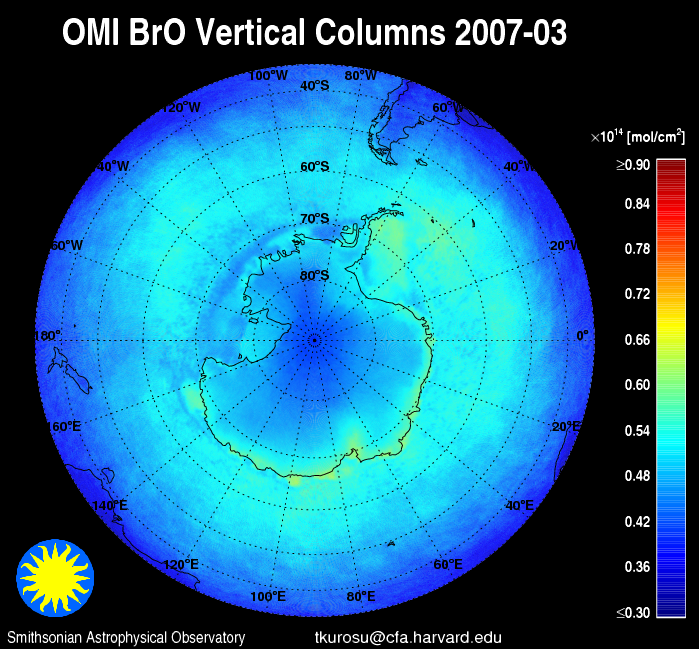
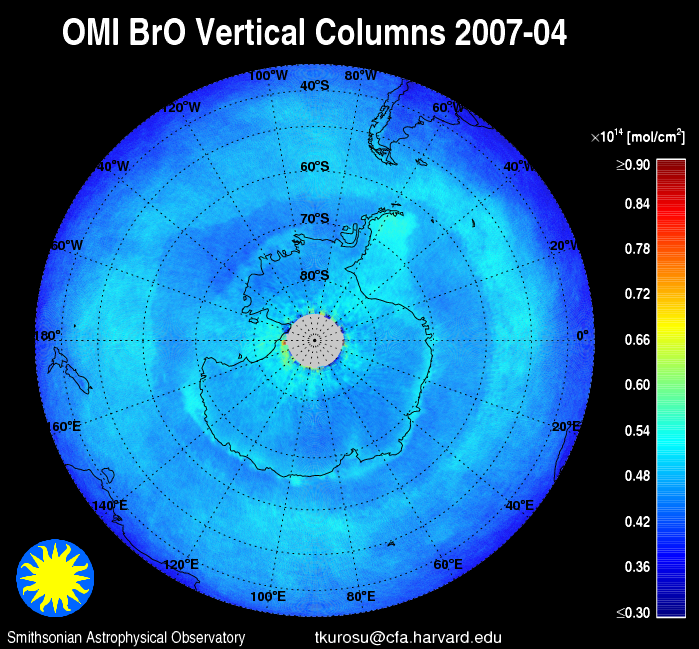
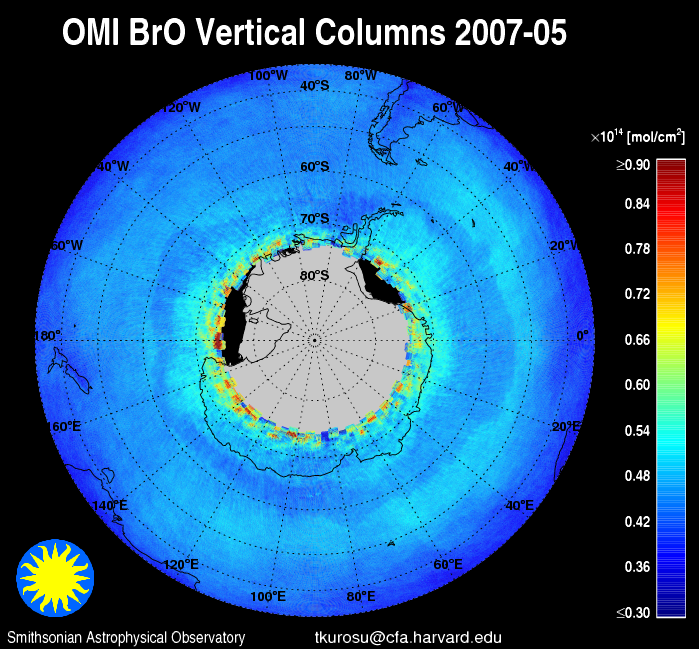
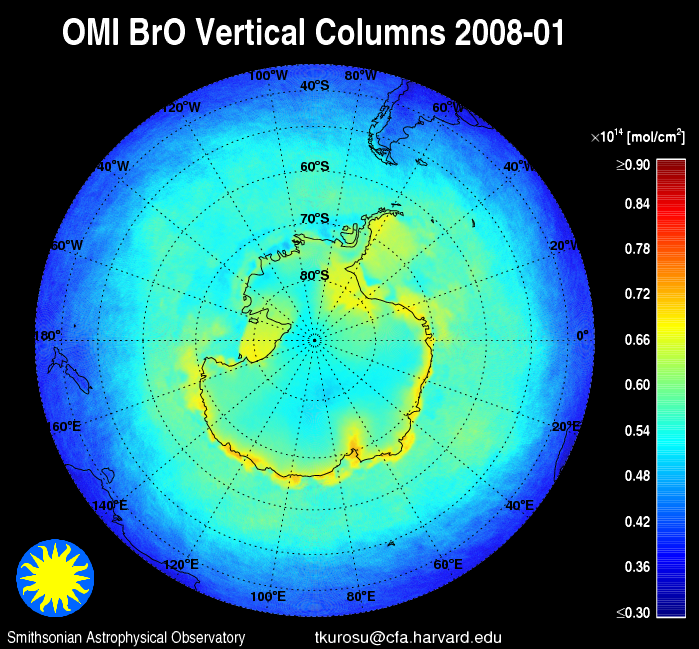
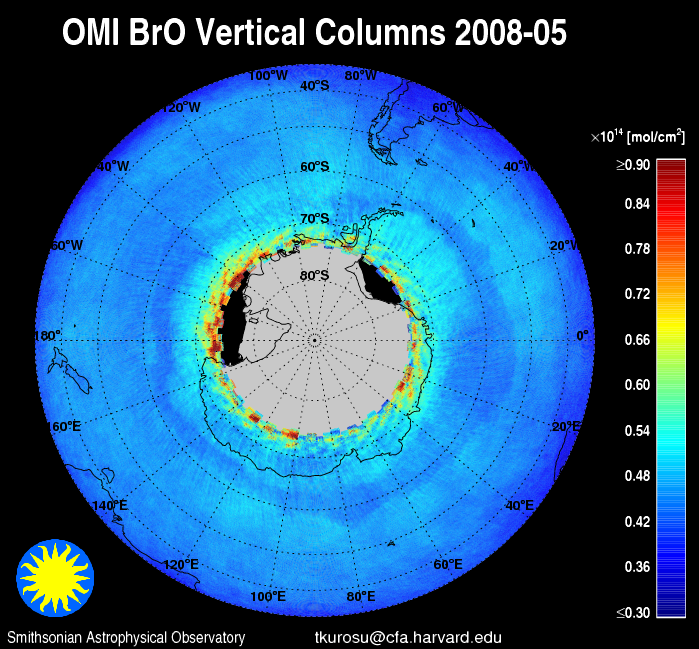
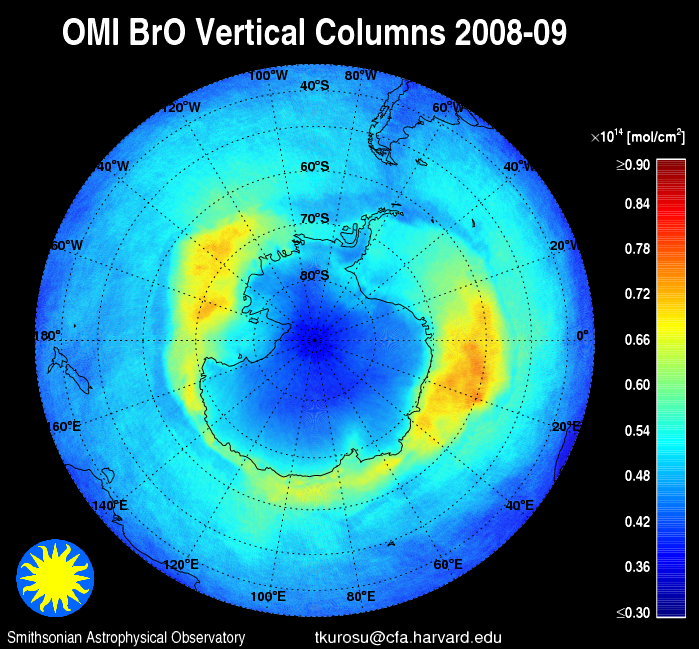
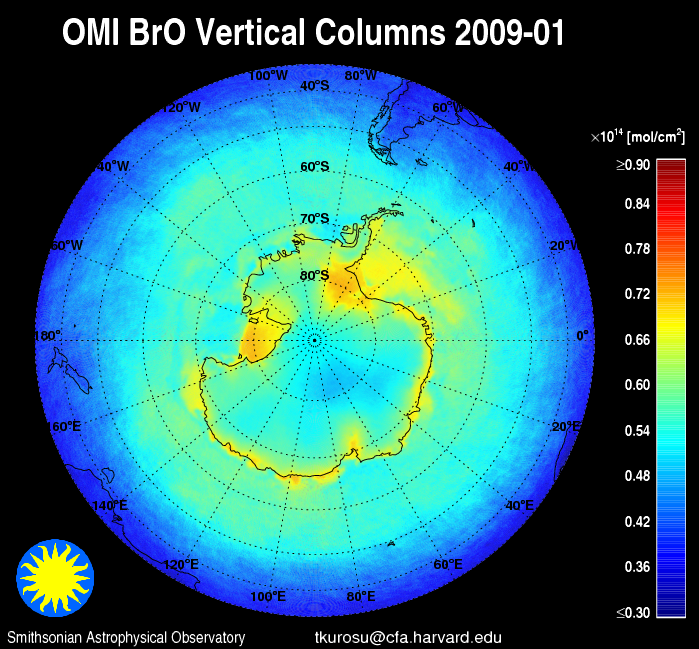
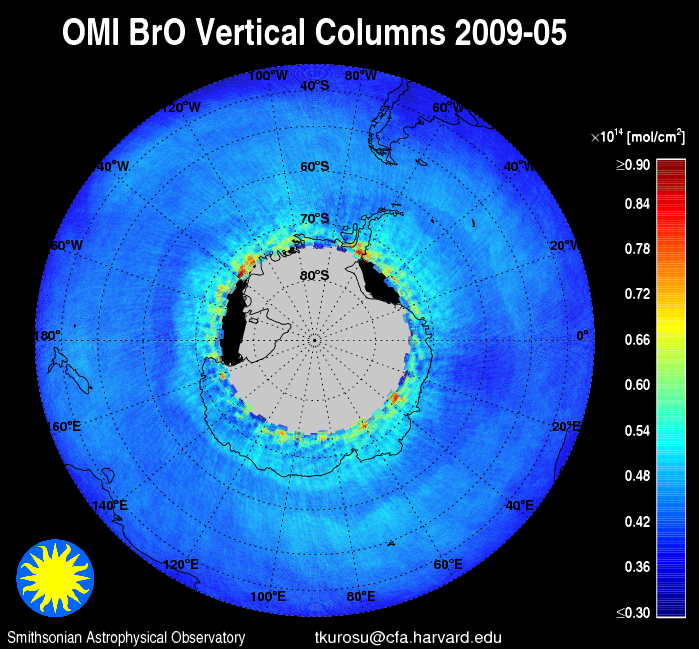
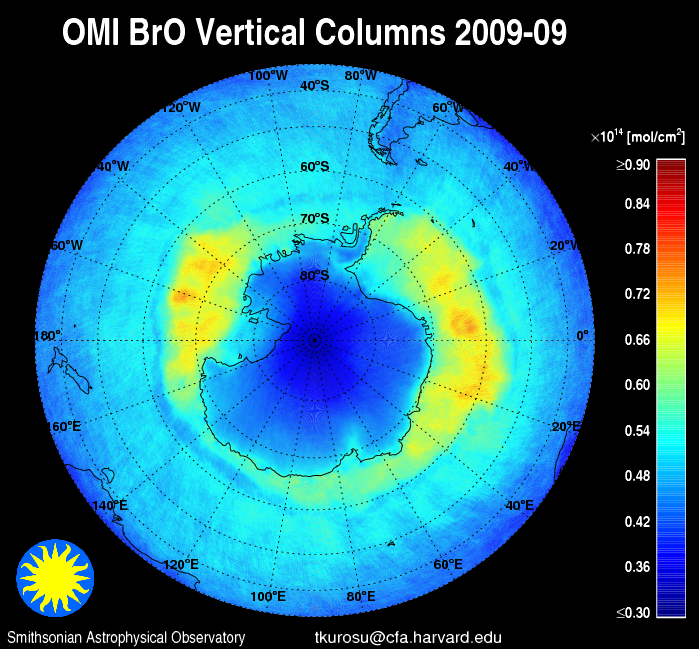
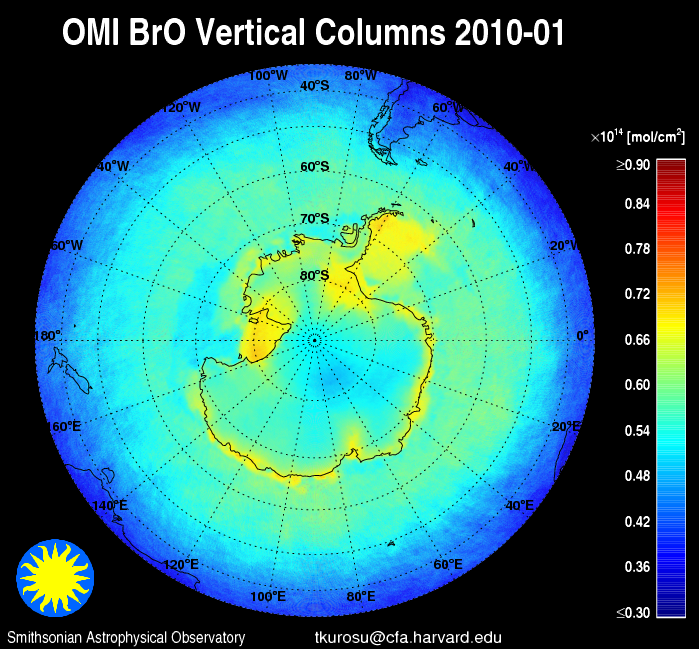
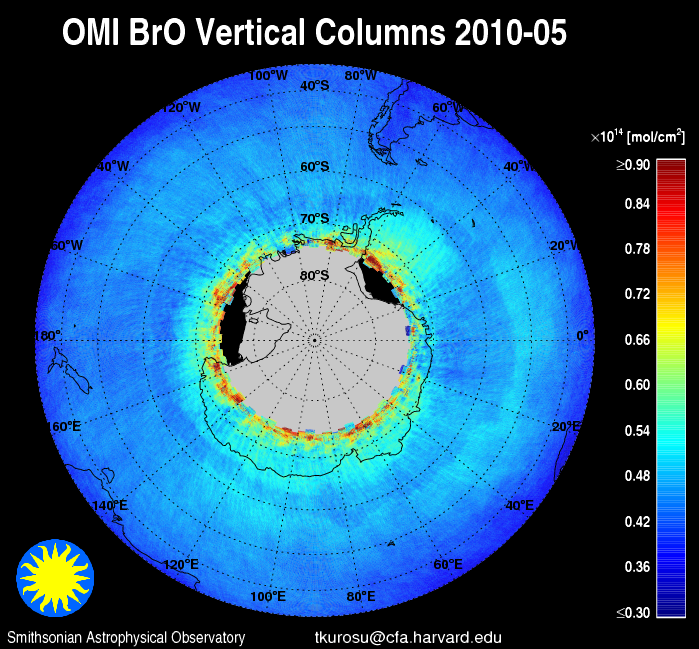
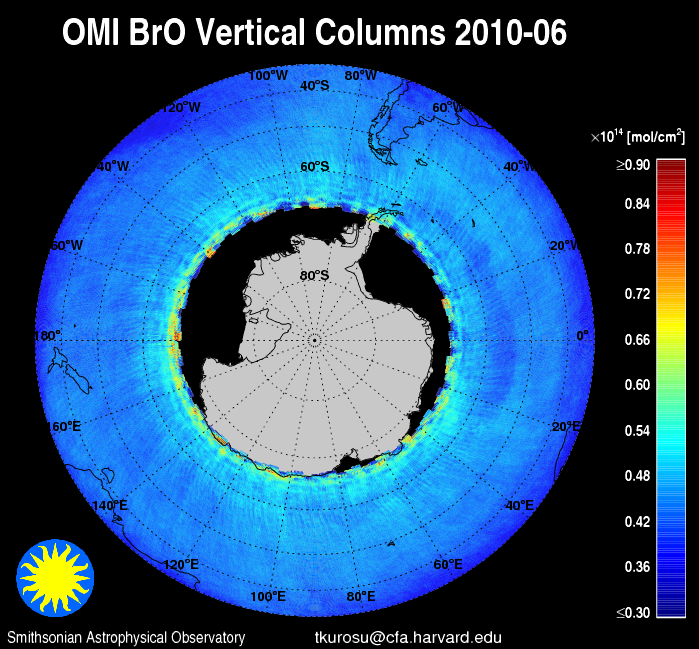
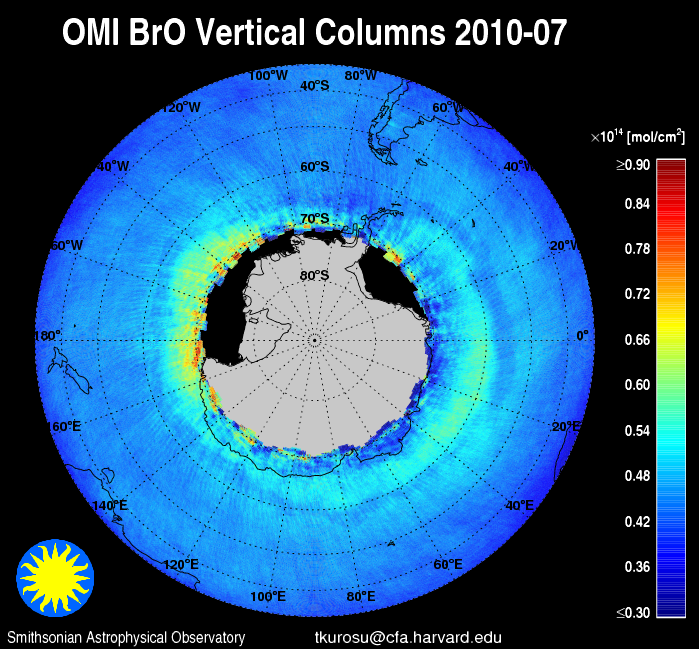
    This page shows monthly average OMI BrO total columns for the northern hemisphere, for all months from 09/2004 and 07/2010. Blank circles over the pole surrounded by positive column values indicate the limit of OMI observations due to illumination conditions. Images show OMI BrO data from Collection 3 processed with the latest off-line version that has been earmarked as the new release candidate. Click on an image to enlarge.

    2004 2005 2006
    2007 2008 2009
    2010


    2004


    SeptemberOctoberNovember
    December


    2005
    JanuaryFebruaryMarch
    AprilMayJune
    JulyAugustSeptember
    OctoberNovemberDecember


    2006
    JanuaryFebruaryMarch
    AprilMayJune
    JulyAugustSeptember
    OctoberNovemberDecember


    2007
    JanuaryFebruaryMarch
    AprilMayJune
    JulyAugustSeptember
    OctoberNovemberDecember


    2008
    JanuaryFebruaryMarch
    AprilMayJune
    JulyAugustSeptember
    OctoberNovemberDecember


    2009
    JanuaryFebruaryMarch
    AprilMayJune
    JulyAugustSeptember
    OctoberNovemberDecember


    2010
    JanuaryFebruaryMarch
    AprilMayJune
    July


    » Solar Spectrum

    SAO2010 Solar Irradiance Reference Spectrum

    » GOME-1, GOME-2, SCIAMACHY, & OMI Ozone Profiles and Tropospheric Ozone
    GOME Ozone and Tropospheric Ozone Profiles


    » Tropospheric Ozone Movies

    Sep. 1996 - Nov. 1997, with GEOS-CHEM comparison

    July 1995 - June 2003


    The World According to GOME

    Atmospheric Measurements -Harvard-Smithsonian Center for Astrophysics