OMI (Data available from October 2004 - June 2009)
If you are interested in using the data, please contact
Xiong Liu for data.
Liu, X., P. K. Bhartia, K. Chance, R. J. D. Spurr, and T. P. Kurosu (2010), Ozone profile retrievals from the Ozone Monitoring Instrument, Atmos. Chem. Phys., 10, 2521-2537.
Liu, X., P. K. Bhartia, K. Chance, L. Froidevaux, R. J. D. Spurr, and T. P. Kurosu (2010), Validation of Ozone Monitoring Instrument (OMI) ozone profiles and stratospheric ozone columns with Microwave Limb Sounder (MLS) measurements, Atmos. Chem. Phys., 10, 2539-2549.
Zhang, L., Jacob, D. J., Liu, X., Logan, J. A., Chance, K., Eldering, A., and Bojkov, B. R., Intercomparison methods for satellite measurements of atmospheric composition: application to tropospheric ozone from TES and OMI, Atmos. Chem. Phys., 10, 4725-4739, doi:10.5194/acp-10-4725-2010, 2010.
Pittman, J.V., L.L. Pan, J.C. Wei, F.W. Irion, X. Liu, E.S. Maddy, C.D. Barnet, K. Chance, R.S. Gao, Evaluation of AIRS, IASI, and OMI ozone profile retrievals in the extratropical tropopause region using in situ aircraft measurements, J. Geophys. Res., 114, D24109, doi:10.1029/2009JD012493, 2009.
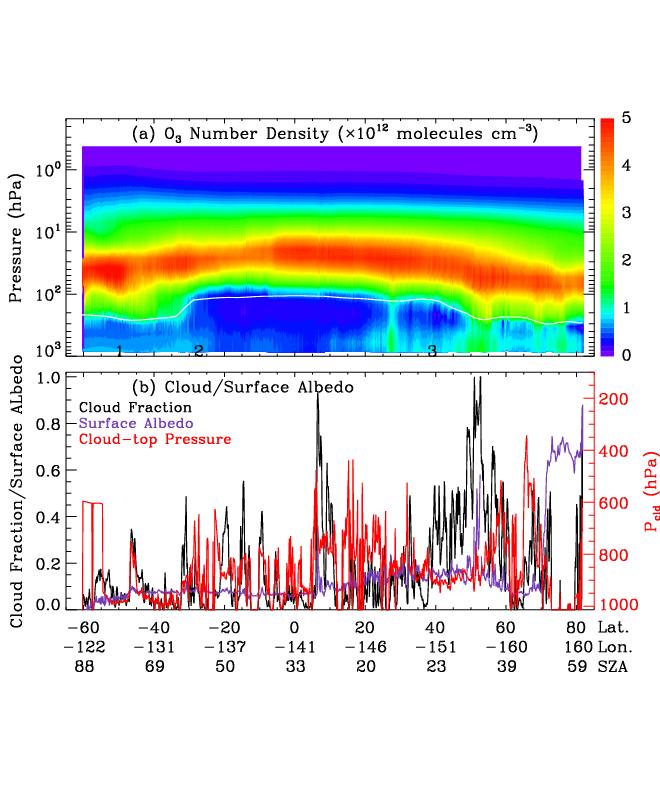
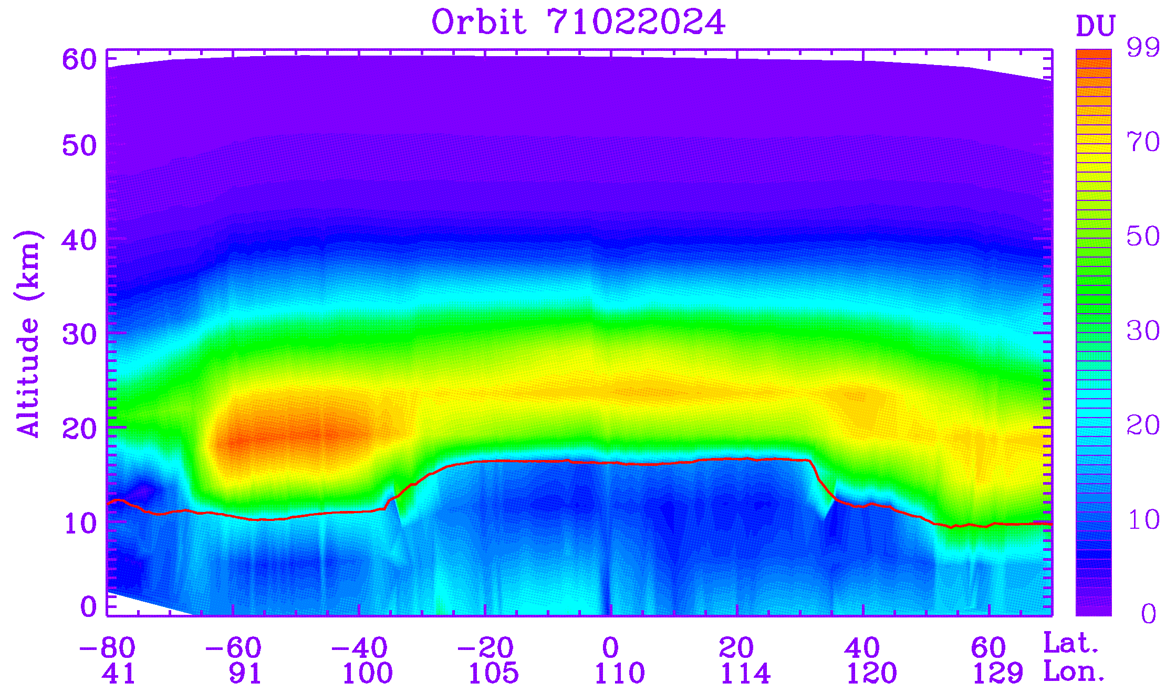
An orbit of retrievals at across-track position 16 (in the UV-1 channel) on 11 July 2006 as a function of latitude, longitude, and solar zenith angle. (a) Ozone profiles in number density, and (b) the effective cloud fraction (black), fitted surface albedo (purple) for the UV-2 channel, and effective cloud-top pressure (red) used in the retrievals. The white line in (a) indicates the NCEP thermal tropopause.06.
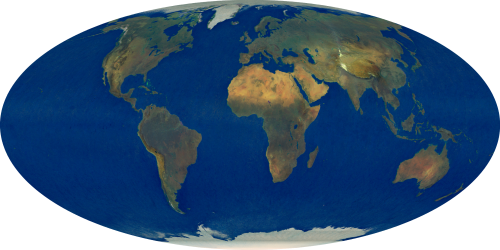
A global map of tropospheric ozone column (with NCEP tropopause) on August 26, 20

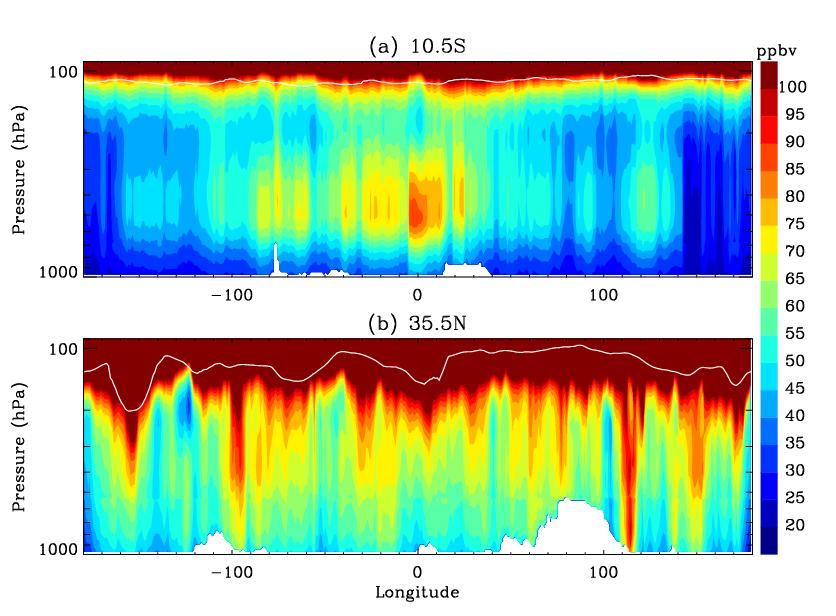
Longitudinal cross sections of ozone volume mixing ratio from the surface to 100 hPa at 10.5ºS and 35.5ºN, corresponding to the dashed white lines in Fig. 8. The retrieved partial ozone columns are interpolated to a finer vertical grid and are converted to volume mixing ratio. The white lines indicate the NCEP tropopause.