

Moment Masking
The CO surveys in this archive typically contain hundreds of spectral channels at each of thousands of independent sky positions. The simplest reduction of such a large data cube is to sum over one of the axes to produce a zeroth moment map, either a velocity-integrated sky map or a position-velocity map. While straightforward and unbiased, this approach substantially degrades the signal-to-noise ratio of typical emission features, which extend over just a small fraction of the spectral channels and sky positions. A common remedy for this problem is "clipping", in which all spectral channels with intensities below some statistical significance level, typically 3 times the rms noise, are set to zero before summing. However, at every reasonable clipping level clipping suffers from dueling biases, a positive one owing to noise spikes extending above the clipping level and a negative one owing to the clipping of both spectral line wings and weak, extended emission. For a typical CO survey, there is no clipping level at which most of the noise is suppressed and most of the emission is maintained.
A shortcoming of clipping is that it determines whether or not a particular spectral channel contains real emission based only on the intensity level in that channel, whereas a seasoned radio astronomer would, in addition, look for spatial and velocity coherence of the signal. Essentially, moment masking is a refinement of the clipping method in which the coherence of the signal---determined from a smoothed version of the data cube---is considered in determining which peaks are real (i.e., not blanked). It is important to emphasize that the smoothed cube is used only to identify and blank certain regions of the raw cube that are likely emission-free. The resulting moment-masked cube maintains its full angular and velocity resolutions, and for sufficiently high masking levels it is unbiased.
A detailed description of the moment masking technique and its optimization for the CO surveys in this archive are given in
Dame (2011).
Here we will simply summarize the results of a numerical experiment from that paper. We start with an essentially noiseless map of a typical molecular cloud, add a large amount of Gaussian noise, then test the effectiveness of both clipping and moment masking for recovering the noiseless map.
A Numerical Experiment
To generate a realistic spectral-line data cube of a molecular cloud that is, for the present purpose, noiseless, we utilize our extensive CO survey of the nearby Taurus-Auriga cloud complex (hereafter, the "Taurus cloud"; DHT21); see Figure 1.

| Figure 1: The Taurus-Auriga CO survey (DHT21) integrated over velocity. |
Taurus is not a particularly large or massive molecular cloud, but it is very close and covers a large solid angle. Consequently more time was spent to beamwidth map this cloud---over 900 hours---than was spent on any other single cloud or complex in the archive. By degrading the angular resolution of this survey by a factor of 8 and then re-sampling on an 8 times courser grid, we can precisely simulate a survey of a cloud like Taurus that is 8 times further away and for which we integrated 64 times as long per point, roughly one hour. Doing this reduces the rms noise per channel from 0.25 K to 0.03 K. Since this noise is negligible compared with the rms Gaussian noise of 0.5 K that we will subsequently add, we will refer to this smoothed cube as "noiseless". Integrating the noiseless cube over velocity yields the Wco map shown in Figure 2a. This is the map we will attempt to reproduce from a very noisy version of the same survey. A sample grid of the "noiseless" spectra is shown in Figure 2b.
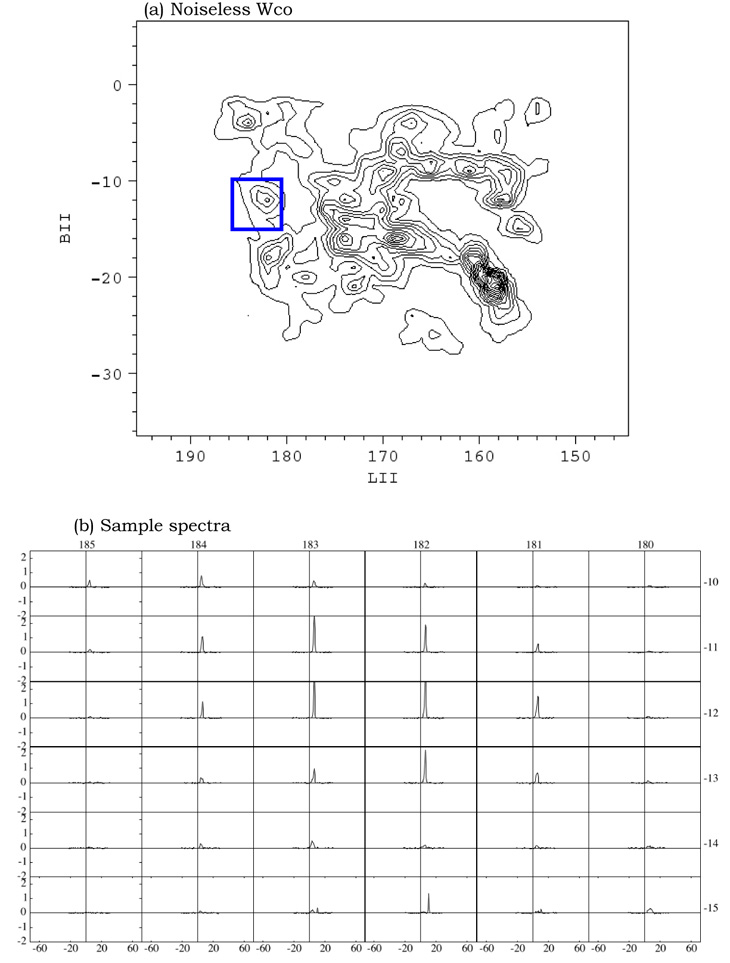
| Figure 2: (a) Velocity-integrated CO map of the Taurus cloud after smoothing to a resolution of 1° and resampling on a 1° grid. Spectra within the region outlined in blue are shown in (b). |
Adding Gaussian noise with an rms of 0.5 K to the cube and again integrating over velocity yields the Wco map in Figure 3a, with contour levels the same as in Figure 2a. The same array of sample spectra, now with the noise added, is shown in Figure 3b.
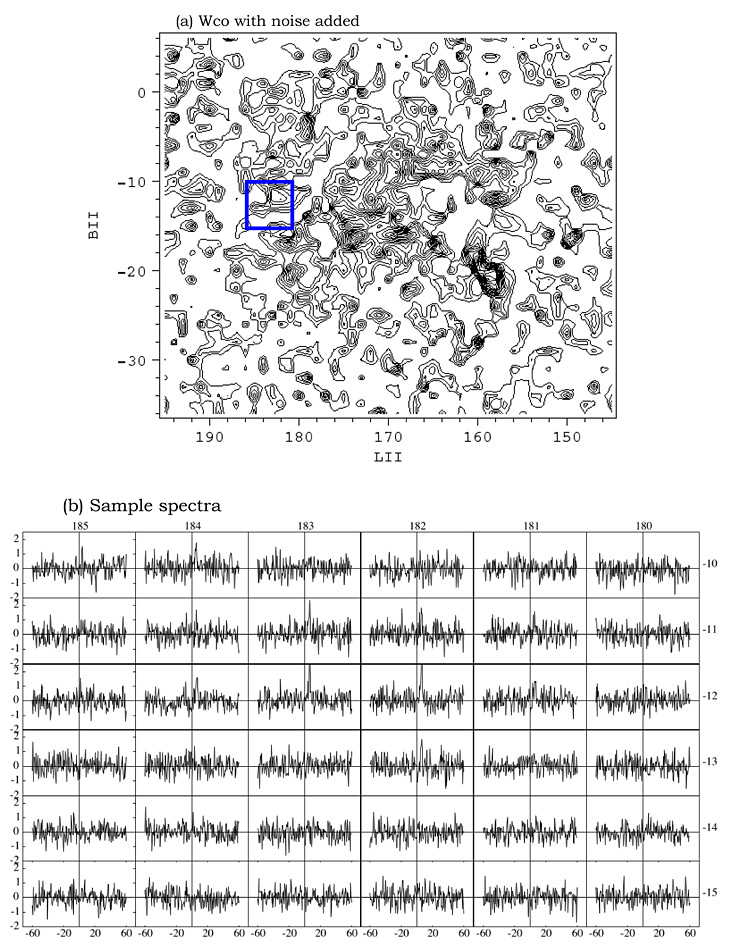
| Figure 3: (a) Velocity-integrated CO map of the Taurus cloud after adding 0.5 K rms of Gaussian noise. Spectra within the region outlined by the blue box are shown in (b). |
Next we generate clipped and moment masked versions of the noisy cube at various clipping and masking levels. Keep in mind that the sigma used for clipping is the raw rms of 0.5 K, whereas in moment masking sigma refers to the rms in the cube after smoothing to a resolution of 2° x 2.5 km/s (see Dame (2011) for details).
Wco maps obtained from the moment masked and clipped cubes at various sigma levels are shown in the Figures 4 and 5 respectively. It's clear from a comparison of these maps with the noiseless map in Figure 2a that moment masking at 5-sigma (Fig. 4c) best reproduces the noiseless map, far better than clipping at any sigma level (Fig. 5). Moment masking below 5-sigma allows pure-noise features to enter the Wco maps while picking up little obvious additional emission. For the purpose of reducing noise there is little advantage to moment masking above 5-sigma, and doing so suppresses some of the weaker emission features (e.g., Fig 4d).

| Figure 4: Moment masked CO maps with the masking level varying from 3-sigma in (a) to 6-sigma in (d). |
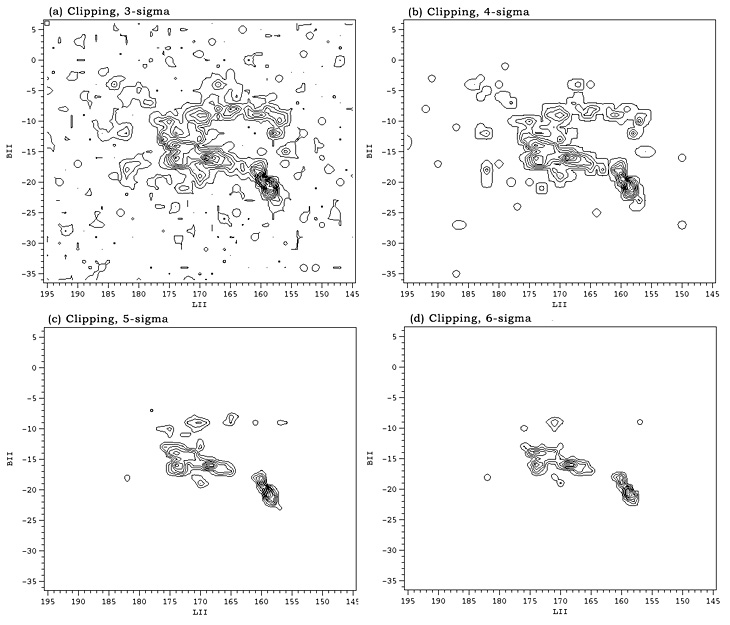
| Figure 5: Clipped CO maps with the clipping level varying from 3-sigma in (a) to 6-sigma in (d). |
For reference, the noiseless Wco map and the one moment masked at 5-sigma are reproduced side-by-side in Figure 6 below.

| Figure 6: A comparison of the noiseless Wco map with that obtained by moment masking at 5-sigma. |
Another criterion for determining the optimum noise suppression technique is to compare the total molecular cloud mass determined from each of the noise-suppressed cubes with that obtained from the noiseless cube. On the usual assumption that H2 column density is proportional to CO velocity-integrated intensity, the total cloud mass is proportional to the sum over all channels in the cube; we will take that sum as the mass for the present purpose. In Figure 7 we plot the cloud mass as determined from cubes clipped and moment-masked over a wide range of sigma levels, and also the true mass determined from the noiseless cube.
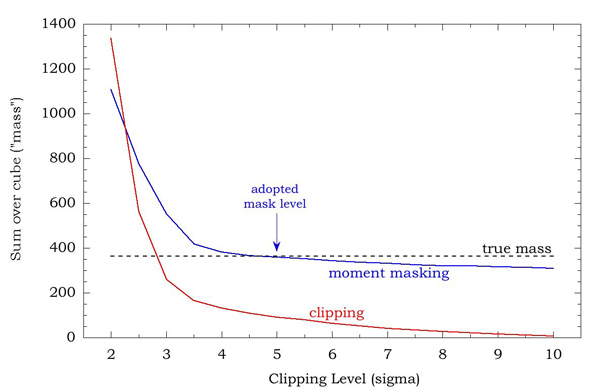
| Figure 7: The total sum over clipped (red) and moment masked (blue) cubes for clipping and masking levels ranging from 2- to 10-sigma. The value of the sum over the noiseless cube is marked by a dashed line. The sum over the cube is proportional to the H2 mass. |
By this criterion also, we find that moment masking at 5-sigma is most effective at reproducing the noiseless result. The clipping technique at ~3-sigma also yields the correct mass but judging from Figure 5a this is clearly owing to a positive noise bias. Both techniques suffer from this bias at low sigma, however clipping suppresses the bias only when significant emission is suppressed as well, whereas moment masking can suppress the bias while still maintaining most of the true emission. The moment-masking technique yields 88% of the true mass even when masking at 10-sigma, since most of the emission comes from large, bright features which have extremely high significance in the smoothed cube.
Summary
We have shown that for a typical molecular cloud such as that in Taurus, the moment masking technique as refined in Dame (2011) is highly effective in removing noise from the spectral line data cube while maintaining most of the emission at the full angular and spectral resolution of the original survey.
In applying the technique we smooth in velocity by only a factor of 2-4 in order to maintain resolution on the narrower spectral lines, and we smooth spatially by only a factor of 2. The spatial smoothing will diminish our sensitivity to single isolated emission peaks, but in a survey with millions of spectral channels there is, in any case, no way to confirm the reality of a single 3-4 sigma peak short of additional observations or reference to other surveys. Masking at 5-sigma in the smoothed cube ensures that no pure-noise features will pass into the moment maps, while our refinement of unmasking all pixels within the smoothing kernel of each 5-sigma peak in the smoothed map ensures that most of the emission in the raw cube is maintained.
In closing we emphasize that while we believe that the moment masking parameters advocated in Dame (2011) are near optimum for analyzing the surveys in this archive, they may not be for other surveys with very different S/N, resolutions, and emission structure.