Testing Local Parallel Processing in CASA
Checking the output of parallelized tcleanCASA Parallelization Overview
Some tasks in CASA can be parallelized. NRAO claim the task that see the biggest gains in processing time are tclean, applycal, and flagdata.
Here we are going to test the tclean task with CASA 5.1.2. First I confirm that tclean produces the same results whether given a list of input files (TEST 1), or a single concatenated file (TEST 2). See the instructions here.
Initial conclusions:
■ As expected, tclean produces the same result whether fed individual files or a concatenated master file (using default options). However, the concatenated file has a shorter processing time.
■ Running tclean in parallel has spectacular time gains. The output looks very similar (but not identical), to the non-parallelized version.
■ The parallel output has marginally higher sum & mean pixel values. This increase only becomes significant when looking at the averaged spectrum. It does hold for regions of noise. It seems that paralleled tclean does a better job of recovering flux.
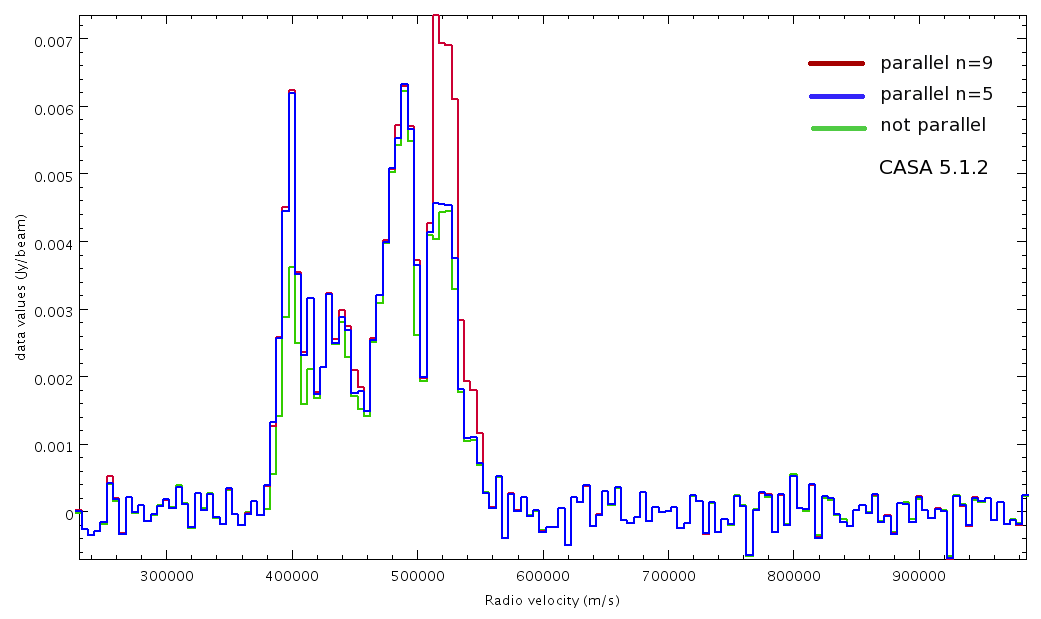
■ The averaged spectra at the bottom of the page show that these gains in flux are dependent on the number of cores chosen for processing. This has to do with how tclean generates an average spectra for each sub-MS.
NRAO expect parallel imaging to be signifcantly more stable from version 5.1.3 which should be released in May 2018. Tests will resume then.
TEST 1
Input: 10 separate measurement sets (from mosaic) Parallel? No Time: 3h45m |
Full spectral cube:
Pixel sum : 91527 Pixel mean : 0.000147011 Standard deviation : 0.0752108 Skewness : -0.19447 Kurtosis : -3.05935 Minimum pixel value : -99.2058 At pixel : (47, 1723, 140, 1) Maximum pixel value : 112.35 At pixel : (4, 1043, 26, 1) Pixel median : -1.87703e-06 Total number of pixels : 622592000 Number of pixels used : 622585763 (100.0%) No. of pixels excluded : 6237 (0.0%) |
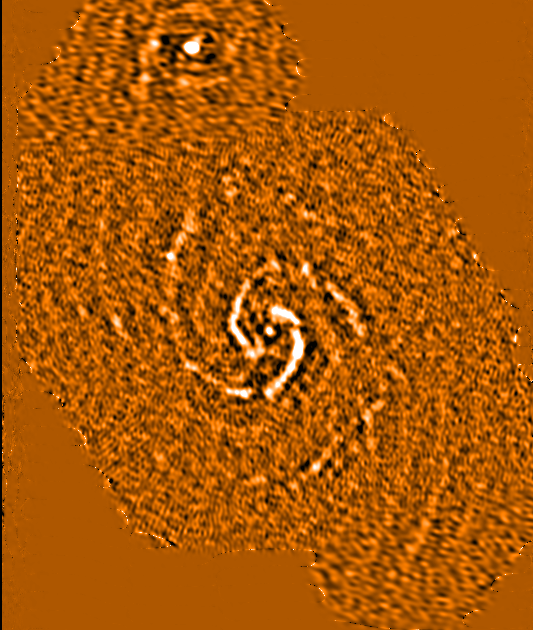
Ellipse of integrated intensity (see figure on right):
Pixel sum : 3.03969e+08 Pixel mean : 389.15 Standard deviation : 10265.4 Skewness : 2.06373 Kurtosis : -2.98812 Minimum pixel value : -37811.1 At pixel : (776, 1282, 1) Maximum pixel value : 132687 At pixel : (887, 1222, 1) Pixel median : -427.936 Total number of pixels : 4096000 Number of pixels used : 781109 (19.1%) No. of pixels excluded : 3314891 (80.9%) |
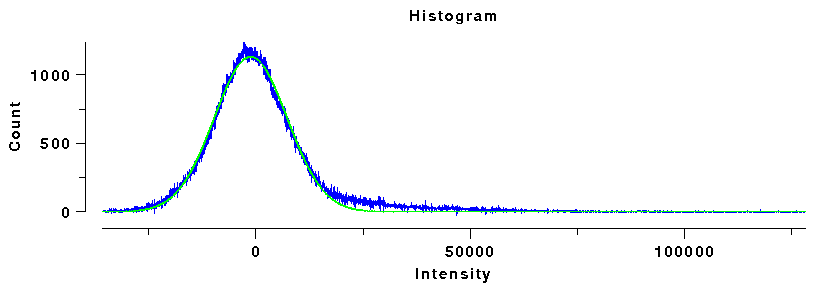
Integrated intensity (99.5% cut)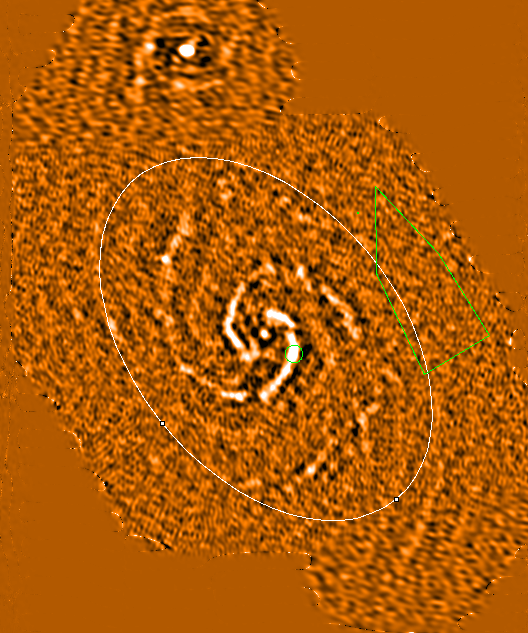
|
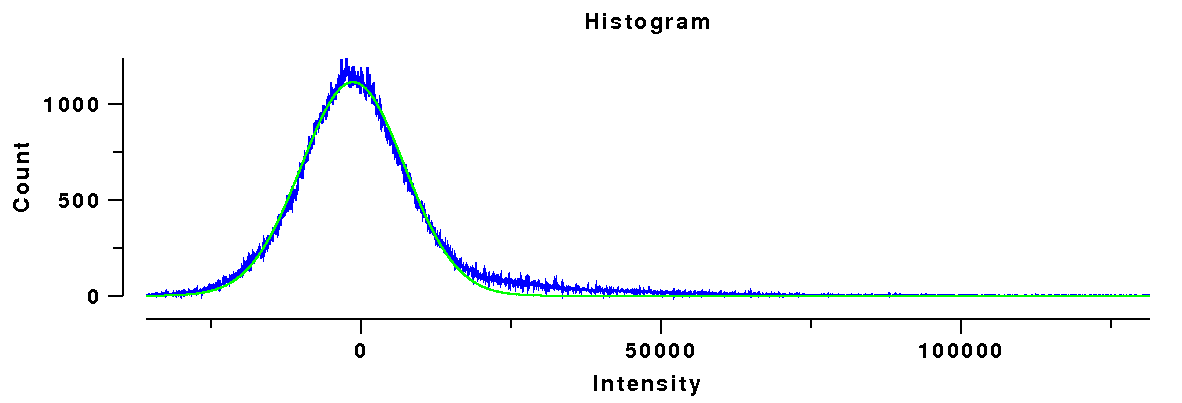
Histogram of ellipse data |
Stats of noise region
(see polygon in figure)
Mean 0.00100928
|
Integrated intensity above 3-sigma:
Pixel sum : 6.89492e+08 Pixel mean : 40858.8 Standard deviation : 16799 Skewness : 2.10626 Kurtosis : 5.75119 Minimum pixel value : 25003 At pixel : (528, 1559, 1) Maximum pixel value : 132687 At pixel : (887, 1222, 1) Total number of pixels : 4096000 Number of pixels used : 16875 (0.4%) No. of pixels excluded : 4079125 (99.6%) |
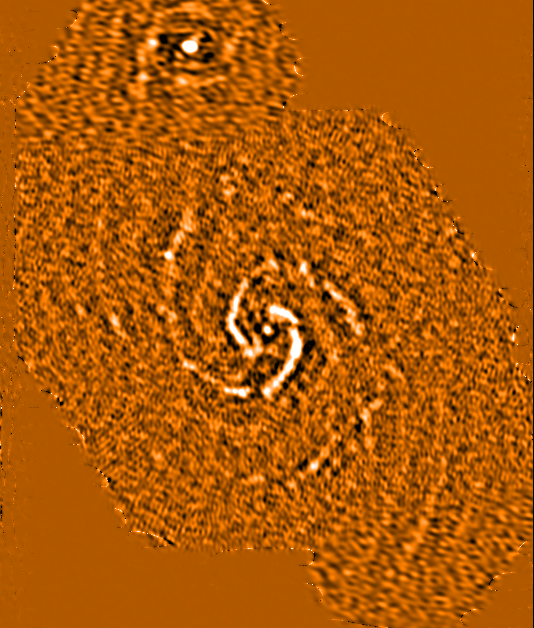
TEST 2
Input: concat (with defaults) the 10 separate measurement sets into single file Parallel? No Time: 3h00m |
 Pixel sum              : 90800
 Pixel mean             : 0.000145843
 Standard deviation     : 0.0752725
 Skewness               : -5.3911
 Kurtosis               : -2.97067
 Minimum pixel value    : -127.511
    At pixel            : (1581, 1136, 86, 1)
 Maximum pixel value    : 73.6167
    At pixel            : (43, 1425, 119, 1)
 Pixel median           : -1.87689e-06
 Total number of pixels : 622592000
 Number of pixels used  : 622585773 (100.0%)
 No. of pixels excluded : 6227 (0.0%)
|
Pixel sum : 3.03971e+08 Pixel mean : 389.153 Standard deviation : 10265.4 Skewness : 2.06374 Kurtosis : -2.98812 Minimum pixel value : -37810.3 At pixel : (776, 1282, 1) Maximum pixel value : 132687 At pixel : (887, 1222, 1) Pixel median : -428.004 Total number of pixels : 4096000 Number of pixels used : 781109 (19.1%) No. of pixels excluded : 3314891 (80.9%) |
|

|
Mean 0.001009395
Std Dev 0.09699952 Max 0.3325383 Min -0.3374223 Total 118.7442 |
Pixel sum : 6.89492e+08 Pixel mean : 40858.8 Standard deviation : 16799 Skewness : 2.10625 Kurtosis : 5.75115 Minimum pixel value : 25003.3 At pixel : (528, 1559, 1) Maximum pixel value : 132687 At pixel : (887, 1222, 1) Total number of pixels : 4096000 Number of pixels used : 16875 (0.4%) No. of pixels excluded : 4079125 (99.6%) |
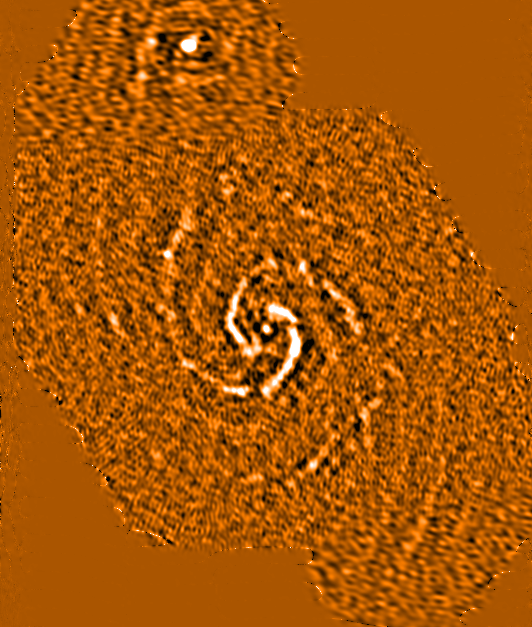
TEST 3
Input: concat the 10 separate measurement sets into single file Parallel? Yes Cores: 9 Time: 45m |
 Pixel sum              : 114150
 Pixel mean             : 0.000183347
 Standard deviation     : 0.0752537
 Skewness               : 7.72432
 Kurtosis               : -2.98198
 Minimum pixel value    : -60.1831
    At pixel            : (87, 1170, 53, 1)
 Maximum pixel value    : 86.9453
    At pixel            : (846, 2172, 94, 1)
 Pixel median           : -1.67351e-06
 Total number of pixels : 622592000
 Number of pixels used  : 622585689 (100.0%)
 No. of pixels excluded : 6311 (0.0%)
|
Pixel sum              : 3.91518e+08
Pixel mean             : 501.234
Standard deviation     : 10287.3
Skewness               : 2.14725
Kurtosis               : -2.98803
Minimum pixel value    : -37060.9
   At pixel            : (1075, 987, 1)
Maximum pixel value    : 132870
   At pixel            : (888, 1221, 1)
         Pixel median           : -388.175
Total number of pixels : 4096000
Number of pixels used  : 781109 (19.1%)
No. of pixels excluded : 3314891 (80.9%)
|
|
|
Mean 0.001009975 Std Dev 0.0969723 Max 0.3312833 Min -0.340028 Total 118.8124 |
Pixel sum : 7.21572e+08 Pixel mean : 40924 Standard deviation : 16735.3 Skewness : 2.07683 Kurtosis : 5.62795 Minimum pixel value : 25001.2 At pixel : (819, 1128, 1) Maximum pixel value : 132870 At pixel : (888, 1221, 1) Total number of pixels : 4096000 Number of pixels used : 17632 (0.4%) No. of pixels excluded : 4078368 (99.6%) |
TEST 4
Input: concat the 10 separate measurement sets into single file Parallel? Yes Cores: 5 Time: 57m |
Pixel sum              : 104136
Pixel mean             : 0.000167264
Standard deviation     : 0.0752265
Skewness               : 7.57816
Kurtosis               : -3.02897
Minimum pixel value    : -74.4938
   At pixel            : (843, 2176, 59, 1)
Maximum pixel value    : 104.372
   At pixel            : (1576, 1141, 137, 1)
Total number of pixels : 622592000
Number of pixels used  : 622585810 (100.0%)
No. of pixels excluded : 6190 (0.0%)
Pixel sum : 3.45422e+08 Pixel mean : 442.22 Standard deviation : 10292.5 Skewness : 2.10265 Kurtosis : -3.01145 Minimum pixel value : -37141.9 At pixel : (895, 1169, 1) Maximum pixel value : 132850 At pixel : (888, 1222, 1) Total number of pixels : 4096000 Number of pixels used : 781109 (19.1%) No. of pixels excluded : 3314891 (80.9%)
|
|
|
Mean 0.0009987468 Std Dev 0.09686029 Max 0.331913 Min -0.3406299 Total 117.4916 Pixel sum : 7.07172e+08 Pixel mean : 40891.2 Standard deviation : 16796.8 Skewness : 2.08016 Kurtosis : 5.62957 Minimum pixel value : 25000 At pixel : (702, 1317, 1) Maximum pixel value : 132850 At pixel : (888, 1222, 1) Total number of pixels : 4096000 Number of pixels used : 17294 (0.4%) No. of pixels excluded : 4078706 (99.6%) |
Differences:
On closer inspection, our tests show significantly different spectral profiles depending on the number of cores chosen.
The spectra plotted below show the average spectrum over a large circle enclosing most emission.
Differences are seen in the emission peaks, although the noise is identical. This difference arises from the degree to which CASA
splits the original dataset and the data it has available to determine an average spectrum.
Notes:
CASA's viewer proved too slow to use with these data, so they were exported as fits and analyzed using Starlink. Example commands:
fits2ndf orig230.fits orig230
ndfcopy in='orig230(,,16:134)' out=orig230_trimspec
collapse in=orig230.sdf out=orig230_integ axis=vrad estimator=integ wlim=0.5
stats orig230.sdf order=true
ardmask orig230_integ.sdf inside=false ard=ardellipse out=orig230_integ-trim
histogram origcomb230_integ-trim.sdf
thresh orig230_integ_trim orig230_integ_trim_thr thrlo=25000 newlo=bad