MIR Questions and Troubleshooting
- Doppler tracking error in 2011-2019 data
- Bandpass calibrator in a different file
- Dealing with phase jumps
- Bad system temperatures
- pass_cal fails with insufficient flux
- No convergence at X. All gains are set to 1.0
- System temperatures are all zero / 3 receivers data recorded. Quit!
- Two antennas on the same pad !
- Chunk 4 looks really noisy
- How do I apply a new antennas file?
- File fails to open reporting 'Illegal subscript range'
- How do I save a series of commands?
- How do change the number of scrollback entries in IDL?
- How do handle the naming of mosaics?
- Doppler tracking error in 2011-2019 data
Data taken between April 4th, 2011 and April 3rd, 2019 were affected by an error related to Doppler-tracking of data, which will affect spectral line measurements of features smaller than 1 km/sec in width. The error in question blurred out data over a velocity width of up to 0.8 km/sec, with a small overall blue-shifting of the line emission by approximately 0.3 km/sec.
The MIR routine ‘uti_hayshft_fix' can be used to fix this error. Generally the program should be used after the full calibration, before the MIRIAD or UVFITS output. Further details on this procedure can be found in the MIR Cookbook.
- Bandpass calibrator in a different file
If the bandpass calibrator is in a different file, you need to concatenate them.
Open and save your science file.
IDL> readdata, dir='file1'
IDL> mir_save,'science1.mir'Open and save the second file containing the bandpass data.
IDL> readdata, dir='file2'
IDL> mir_save,'science2.mir'Combine the files by following the prompts.
IDL> sma_dat_merge - Dealing with phase jumps
Unless you have a very strong science target it is usual to only see phase jumps in the gain calibrator data. If there is a phase jump, you will see the phase of calibrator data changing significantly (>50-70°) between one point and the next. In between these points is science data. all of this science data should be flagged as there is no way of knowing exactly when the jump occurred.
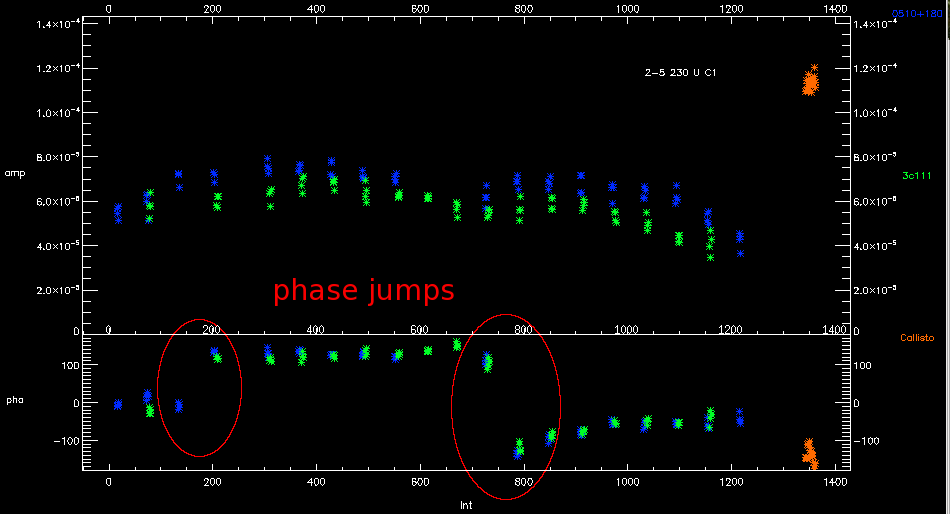
You should then connect the points with a simple join-the-dots fit during phase based gain calibration (/connect). It is also recommended that you average the integrations for each target together to improve the signal to noise (/preave).
IDL> gain_cal,cal_type='pha',tel_bsl='telescope',refant=3,/connect,/preav - Bad system temperatures
There a few options for dealing with bad Tsys values. If you have a few outliers, the simplest is to simply flag those above a certain value. In the example below the cut-off is 1000K.
IDL> result=dat_filter(s_f, ' "tssb" gt "1000" and "wt" gt "0"',/reset)If there is something fundamentally wrong with the Tsys values, e.g. a few points that are wildly, but consistently, off the curve, you can try uti_tsys_fix. The system temperature is a predictable function of elevation and opacity. this task recalculates the Tsys and forces the errant points onto the correct curve. This does refit baseline-by-baseline; antenna based refits, while available, are not currently reliable. The example below uses only data below 750K to derive the curve, the only tries to refit data more than 100K away from the curve.
IDL> uti_tsys_fix,tel_bsl='telescope',high=750,loose=100,/refitIf this fails you can substitute in the values from a different antenna. the example below replaces antenna 7 with antenna 5.
IDL> tsys_ant


IDL> tsys_replace


     7


     5


IDL> tsys_bsl
Note that if you see very high Tsys values appear on some antennas at an elevation <24° it may be that the antenna in question was looking at Subaru.
- pass_cal fails with insufficient flux
Make sure you are running pass_cal with the /preavg option. This averages channels together to boost the signal-to-noise. You can specify how many channels to average together. For full resolution data you may have to go up to /preavg=64 for weak sources. You should scale the value by the rebin factor for rechunked data.
IDL> pass_cal,tel_bsl='telescope',refant=4, preavg=8If that fails, it may be that phase offsets between the different chunks are averaging to zero resulting in low continuum amplitudes. This can lead to insufficient flux for passband calibration. If this is the case, you can try selecting just one or two chunks (for SWARM).
IDL> select,/pos,/res,band=['s1','c1']
IDL> uti_avgbandThis will regenerate the continuum channel using just S1, which could improve your amplitudes.
- No convergence at X. All gains are set to 1.0
This error can appear during band pass calibration. Try using a difference reference antenna with the refant parameter for pass_cal. You can also increase the /preavg value to boost the signal to noise.
- System temperatures are all zero / 3 receivers data recorded. Quit!
These arise from the same issue. Some scans can get mislabeled as the wrong receiver which leads to tracks suffering from problems loading the Tsys. Note the Quit! in the second error only refers to loading the Tsys values.
The solution is to identify the mislabeled data, manually set the label to the correct code, then rerun the Tsys reading program for the whole dataset.
- First figure out the receiver headers in data. You can find the receiver header index with
IDL> print, c.rec

230 345 400 240 - Then check which receivers it thinks are there.
IDL> print,uti_distinct(bl.irec,nrec,/many)

0 2 3
The code means 0 = rx230, 1 = rx345, 2 = rx400, and 3 = rx240. In this case the data was taken with a 230GHz/240GHz receiver configuration so any data with code 2 is mislabeled. Note that it is possible to see data mislabeled as code = -1.
- The mislabeled data usually comes from a single receiver, and the value returned for the mislabeled data is the difference of the two headers with correctly labeled data. However, this is not always the case, due to internal flagging during data acquisition affecting each receiver differently.
- To check which insert (0, 1, 2 or 3) it should be, count the scans for each receiver and see which one is missing data. E.g.
IDL> result=dat_filter(s_f,'"irec" eq "0"',/reset)

       283310 passed in filter

IDL> result=dat_filter(s_f,'"irec" eq "2"',/reset)

      630 passed in filter

IDL> result=dat_filter(s_f,'"irec" eq "3"',/reset)

      282640 passed in filter
If the mislabeled data appears comes from both receivers (verified by plotting with x=fsky), they should be flagged.
- Here is looks like the code 2 data must belong to rx240 (code 3). To rectify this, select the code 2 data, set it to code 3, reselect all the data, then re-read the Tsys.
IDL> result=dat_filter(s_f,'"irec" eq "2"',/reset)

IDL> bl[pbf].irec=3

IDL> select,/res

IDL> readtsys2 - You may end up with very high Tsys values which will need flagging. The steps below flag Tsys values above 1200K.
IDL> result=dat_filter(s_f, ' "tssb" gt "1200" ',/reset)

      430 passed in filter

IDL> flag,/flag

IDL> select,/pos,/res
- First figure out the receiver headers in data. You can find the receiver header index with
- Two antennas on the same pad !
The antennas file is loaded to check the uvw coordinates calculation in the data header. This message implies the antennas file is corrupted, although it can arise when one of the antennas in question is in the hanger. If you open the file you will see two antenna numbers at the same x,y coordinates. You can choose to ignore this, although if the original uvw calculation was wrong, it will not be fixed. This only happens very occasionally. It can be corrected and the data fixed. Send an email requesting the correct antennas file.
- Chunk 4 looks really noisy.
Chunk 4 of SWARM can suffer from high instrumental noise and you may see a result like this after successful calibration.
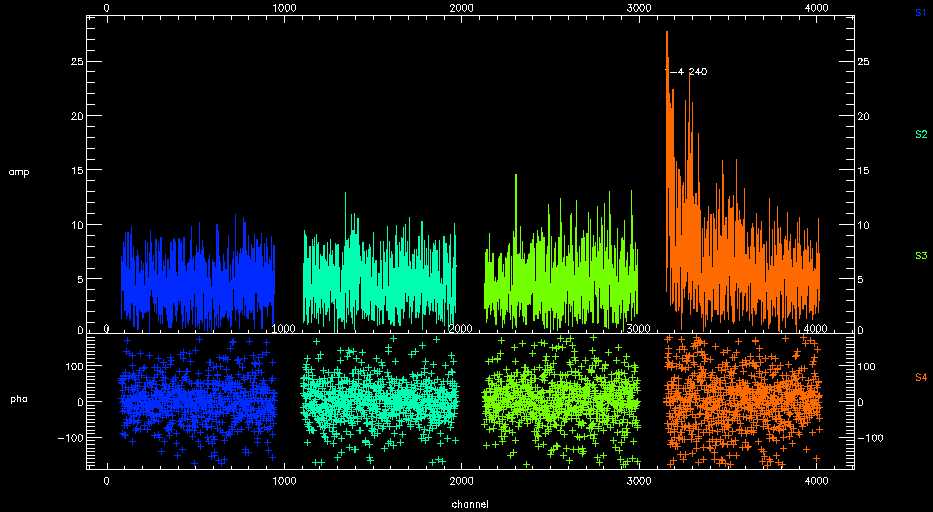
If you replot the spectra against frequency (plot_spectra,color='band',ntrim='80',x='fsky'), you can see that it the end of the band that has problems. This is known issue.
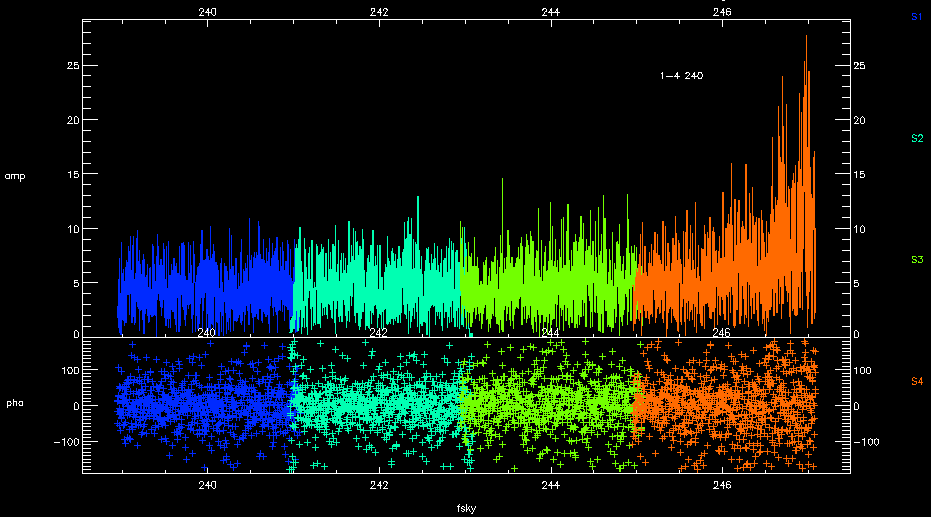
You may choose to flag the whole chunk depending on your science goals. Unfortunately there is no way in MIR to flag data based on frequency or channel number. If you wish to selectively remove the noisy region you can do so in MIRIAD or CASA. - How do I apply a new antennas file?
After an array configuration change (e.g from compact to extended) a specialized track is run to determine the new antenna positions. Once obtained, these positions are applied to future science tracks (as the antennas file in the science directory), but the updated file is not applied retroactively to earlier tracks. You can check which data needs a corrected antenna file applied by checking Updating SMA Baselines. Apply the correction in MIR with a single command.
IDL> select,/pos,/res IDL> sma_cal_bas Enter the current ANTENNAS file: Enter the new ANTENNAS file: - File fails to open reporting 'Illegal subscript range'
You may find a file fails to open on the last scans returning this error.
readdata,dir='myfile'
****************************New data format ...
******** OS TYPE ***********
Platform =x86_64
finished reading headers
number of integrations          961
number of spectra       201600
reading integration from           0 to           99
reading integration from         100 to          199
....
....
reading integration from         900 to          960
% Illegal subscript range: SP (DATA_SET).
% Execution halted at: DBI_CHAN2_READ2    99
   /opt/mir/idl/pro/sma/dbi_chan2_read2.pro
%                      READDATA          110 /opt/mir/idl/pro/sma/readdata.pro
In this case, the file was not ended correctly and the last integration was corrupted. You can avoid this by only reading in the good scans. Decrement the number of integrations reported by readata by 1 or 2 and try again.
IDL> readdata,dir='myfile',int=[0,959] - How do I save a series of commands?
you can view all the command you've typed using
IDL> help,/recall_commandsOr you can save them (along with the text output) to a .pro log file in your local directory using the
journalcommand.To start recording type
journaland give a name for the log file.IDL> journal, "myfile.pro"Type away with your reduction. Then to close out the journal type the
journalcommand again.IDL> journal - How do I change the number of scrollback entries in IDL?
You can set this in the .idlstartup script in your home directory. If it doesn't exist then just create it. To set the scrollback number to 512 entries just add the line
!edit_input = 512 - How do I handle the naming of mosaics?
The observing script appends the offset coordinates to the sourcename for each pointing, resulting in a different name for each individual pointing. This can be cumbersome, especially for the bigger mosaics which may have upwards of 50 pointings. However these names can be combined into one so all the pointings can be treated as a single source in MIR.
If source names look like this for example, M51_+161.04_+139.465, M51_+134.2_+139.465, M51_+107.36_+139.465, M51_+107.36_+48.321, they can be collapsed using
IDL> uti_mosaic_fix, source='M51'The individual source names are retained however can be can still be viewed using
IDL> print, c.sourceA single pointing can then be selected like by feeding the desired offsets to the result command.
IDL> result=dat_filter(s_f, '"source" like "M51" and "offx" eq "13.42" and "wt" gt "0"', /reset)
- How do I handle the naming of mosaics?