|
From Reference:
"Dense Cores in Dark Clouds. XIV. N2H+ (1-0) maps of Dense Cloud Cores"
by Paola Caselli,
Priscilla J. Benson, Philip C. Myers, and Mario Tafalla |
| Additional Maps and Images |
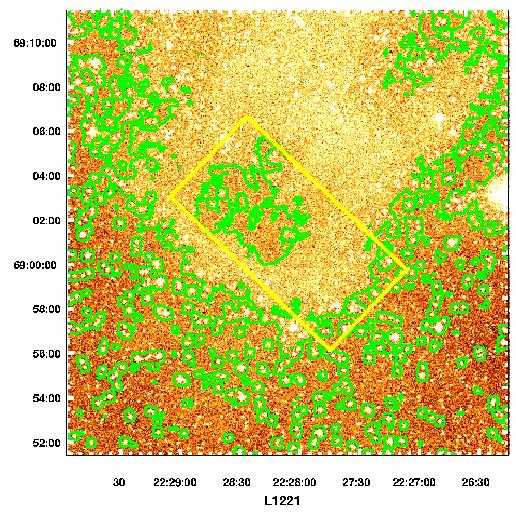
Maps of the N2H+ (1-0) intensity integrated over the seven hyperfine components. The contours and the gray scale represent 20%, 35%, 50%, 35%, 85%, and 90% of the map peak. The thick contour is the half-maximum (50%) level, which defines the core size. The stars indicate the location of the associated infrared source detected by IRAS.
N2H+ (1-0) integrated intensity maps of those cores where "local" velocity gradients have been calculated. The gray-scale levels represent 30%, 50%, 70%, and 90% of the map peak. Small dots mark the position of observed spectra where the determination of V LSR from the hfs fit has been possible. The thin arrows show the magnitude and the direction of the velocity gradient calculated by applying the least-squares fitting routine to the grid of positions centered on the corresponding arrow. The thick arrow in the bottom of the panel represents the total velocity gradient. |
|