Key:
D = Detected
ND = Not Detected
NA = Not Applicable
(---) = no observation made |
Cores L1251A,C,E |
|
|
|
List of ADS links regarding cloud | List of Simbad links regarding cloud |
| Core Name |
RA (J2000) |
Dec (J2000) |
d (pc) |
Size
(arcmin^2) |
Ground Observations
(Single Point) |
Ground Observations
(Map) |
|
Continuum
(micrometers) |
| IRAS
Source |
| h | m | s |
deg | ' | " |
CS
(2-1) |
N2H+
(1-0) |
Ref. |
CS
(2-1) |
N2H+
(1-0) |
Ref. |
1100 |
850 |
450 |
| L1251A |
22 |
30 |
00.50 |
75 |
44 |
16.0 |
|
|
D |
D |
L1 |
--- |
--- |
L2 |
--- |
--- |
--- |
NA |
| Images |
DSS-2 Red
 |
IRSA
 |
Post-Launch Infrared
 |
IPAC
 |
|
|
|
Spectra and Maps Available
(pertinent figures from L1 and L2 regarding L1251A) |
From Reference L1
 |
From Reference L2
(No Images Available) |
|
|
From Reference:
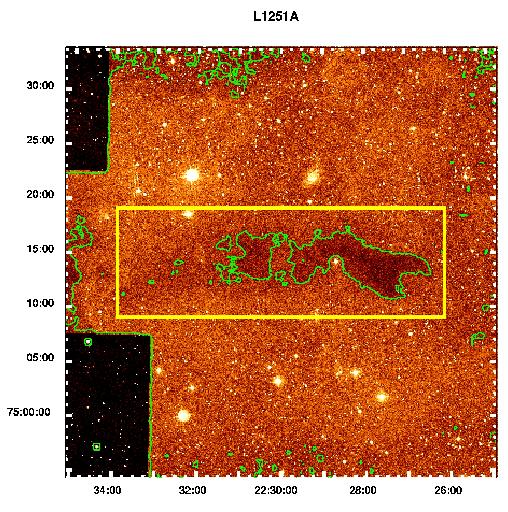
"Dense Cores in Dark Clouds. XIV. N2H+ (1-0) maps of Dense Cloud Cores"
by Paola Caselli,
Priscilla J. Benson, Philip C. Myers, and Mario Tafalla |
| Additional Maps and Images |
Maps of the N2H+ (1-0) intensity integrated over the seven hyperfine components. The contours and the gray scale represent 20%, 35%, 50%, 35%, 85%, and 90% of the map peak. The thick contour is the half-maximum (50%) level, which defines the core size. The stars indicate the location of the associated infrared source detected by IRAS. |
|
|
List of ADS links regarding cloud | List of Simbad links regarding cloud |
| Core Name |
RA (J2000) |
Dec (J2000) |
d (pc) |
Size
(arcmin^2) |
Ground Observations
(Single Point) |
Ground Observations
(Map) |
|
Continuum
(micrometers) |
| IRAS
Source |
| h | m | s |
deg | ' | " |
CS
(2-1) |
N2H+
(1-0) |
Ref. |
CS
(2-1) |
N2H+
(1-0) |
Ref. |
1100 |
850 |
450 |
| L1251C |
22 |
35 |
14.00 |
75 |
15 |
55.0 |
|
|
--- |
--- |
--- |
--- |
--- |
--- |
--- |
--- |
--- |
|
| Images |
DSS-2 Red
 |
IRSA
|
Post-Launch Infrared
|
IPAC
|
|
|
|
Spectra and Maps Available
(pertinent figures from L1 and L2 regarding L1251C) |
From Reference L1
(No Images Available) |
From Reference L2
(No Images Available) |
|
|
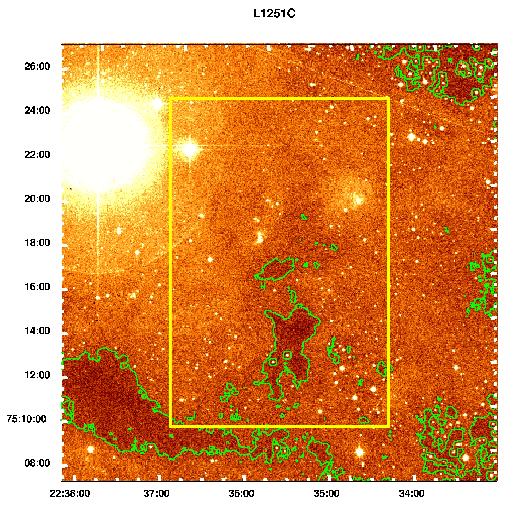
From Reference:
"Dense Cores in Dark Clouds. XIV. N2H+ (1-0) maps of Dense Cloud Cores"
by Paola Caselli,
Priscilla J. Benson, Philip C. Myers, and Mario Tafalla |
| Additional Maps and Images |
Maps of the N2H+ (1-0) intensity integrated over the seven hyperfine components. The contours and the gray scale represent 20%, 35%, 50%, 35%, 85%, and 90% of the map peak. The thick contour is the half-maximum (50%) level, which defines the core size. The stars indicate the location of the associated infrared source detected by IRAS. |
|
|
List of ADS links regarding cloud | List of Simbad links regarding cloud |
| Core Name |
RA (J2000) |
Dec (J2000) |
d (pc) |
Size
(arcmin^2) |
Ground Observations
(Single Point) |
Ground Observations
(Map) |
|
Continuum
(micrometers) |
| IRAS
Source |
| h | m | s |
deg | ' | " |
CS
(2-1) |
N2H+
(1-0) |
Ref. |
CS
(2-1) |
N2H+
(1-0) |
Ref. |
1100 |
850 |
450 |
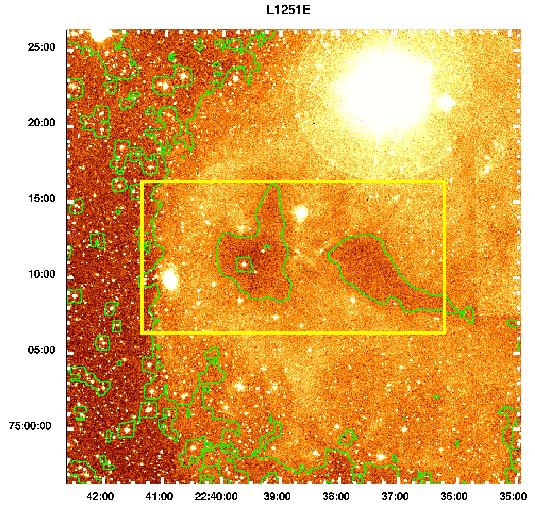
| L1251E |
22 |
38 |
47.2 |
75 |
11 |
29 |
300 |
10 x 10 |
NA |
NA |
--- |
NA |
NA |
--- |
--- |
--- |
--- |
22376+7455 |
| Images |
DSS-2 Red
 |
IRSA
|
Post-Launch Infrared
|
IPAC
|
|
|
|
| Additional Maps and Images |
From Reference:
"Dense Cores in Dark Clouds. XIV. N2H+ (1-0) maps of Dense Cloud Cores"
by Paola Caselli,
Priscilla J. Benson, Philip C. Myers, and Mario Tafalla |
Average N2H+ (1-0) spectra of core, obtained by summing all the spectra inside the half-maximum map contour. The spectrum is in antenna temperature units.
Maps of the N2H+ (1-0) intensity integrated over the seven hyperfine components. The contours and the gray scale represent 20%, 35%, 50%, 35%, 85%, and 90% of the map peak. The thick contour is the half-maximum (50%) level, which defines the core size. The stars indicate the location of the associated infrared source detected by IRAS.
N2H+ (1-0) integrated intensity maps of those cores where "local" velocity gradients have been calculated. The gray-scale levels represent 30%, 50%, 70%, and 90% of the map peak. Small dots mark the position of observed spectra where the determination of V LSR from the hfs fit has been possible. The thin arrows show the magnitude and the direction of the velocity gradient calculated by applying the least-squares fitting routine to the grid of positions centered on the corresponding arrow. The thick arrow in the bottom of the panel represents the total velocity gradient.
Map of line width (gray scale) overlapped with integrated intensity map (contours; levels are 30%, 50%, 70%, and 90% of the peak). Gray contours range from  vmin to vmin to  vmax in steps of 2 vmax in steps of 2  where is the mean line width error in the selected positions. Gray areas enclose all the points with v values between two adjacent gray contours. The dots mark the positions that have been used in the v maps (i.e., where v/ where is the mean line width error in the selected positions. Gray areas enclose all the points with v values between two adjacent gray contours. The dots mark the positions that have been used in the v maps (i.e., where v/ v v  3 and I/I 5). Values of vmin, vmax, and 2 (in units of km s-1) in L1251E are as follows: 0.37, 1.91, and 0.27 3 and I/I 5). Values of vmin, vmax, and 2 (in units of km s-1) in L1251E are as follows: 0.37, 1.91, and 0.27 |
|
|
|
|
|
|
