


Next: SPECTRA
Up: Basics in Imaging, Deconvolution
Previous: Self-calibration and Continuum Image
The basic calibration procedure of spectral line shares the same Miriad tasks as discussed in the continuum data calibration.
A step-by-step procedure of the reduction for SMA spectral line data
(that was produced from old standard correlator mode with 24 spectral chunks
per sideband) in Miriad was demonstrated. Here is a link to the detailed
step-by-step procedure (Flow Chart and Script).
In the follows, a few plots that were illustrated in the demostration
are shown.
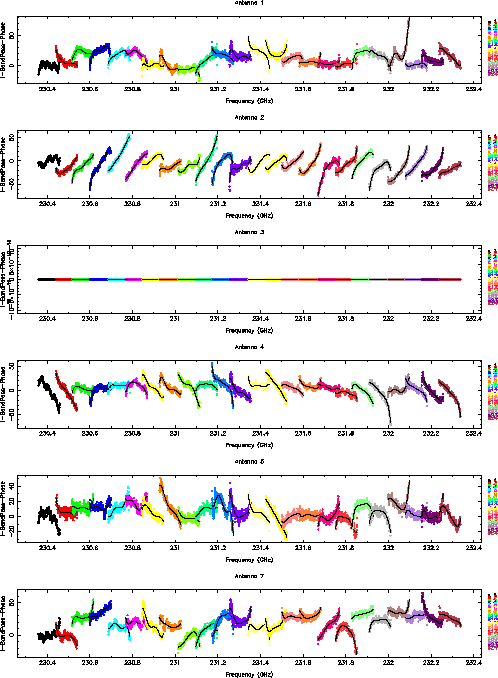
Figs. 4.5. and 4.6. show the antenna-based bandpass solutions solved from
3C 454.3 observed during the time between 14:00-14:45.
Figure:
The solid dots are the solutions of bandpass in ampltiude
which is color-coded for chunks. The solid black
curves are the 5th order polynomial fit to the solutions.
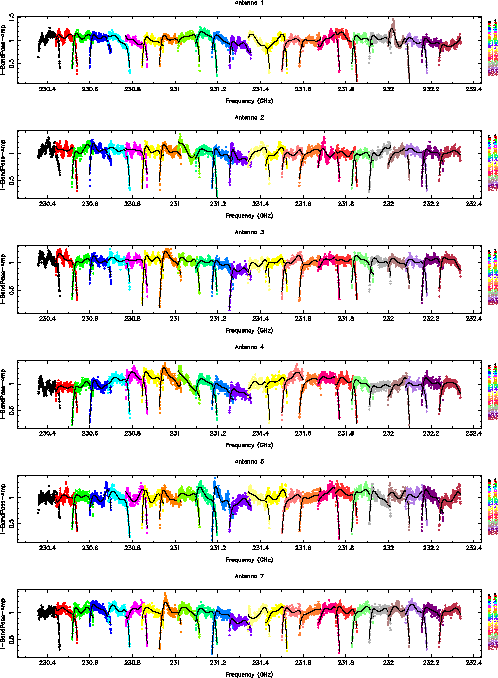 |
Figure:
The solid dots are the solutions of bandpass in the unwrapped
phase which is color-coded for chunks. The solid
black curves are the 5th order polynomial fit to the solutions.
 |
It may be necessary to have bandpass solutions in more than one
time intervals distributed evenly over the observing run
so that any possible bandpass ripples can be
checked and calibrated. In addition, baseline-based (and/or chunk-based)
bandpass solutions with a strong point source
may also be necessary for minimizing any correlator-based
bandpass errors.
Subsections
Next: SPECTRA
Up: Basics in Imaging, Deconvolution
Previous: Self-calibration and Continuum Image
Jun-Hui Zhao (miriad for SMA)
2012-07-09