


Next: GLUE SMA MULTI-CHUNK FILES
Up: Utility Tools
Previous: LINEAR REGRESSION BETWEEN 230/690
One might want to further investigate the origin of
the variations in the residual
phase. One possiblity is that changes of
ambient temperature might affect on
the residual phase. The ambient temperature data along with other engineer
data has been stored in SMA sybase. Here we provide a
C-shell script to extract ambient temperature data from the SMA Sybase
TambSybase.csh. The script (TambSybase.csh)
can be also obtained from $MIR/examples. On the linux computer (d2o.sma.hawaii.edu) at the SMA site in Hawaii,
one can execute this script. There are different type of tempratures
that were recorded and stored as a RM variable in SMA Sybase.
For example, RM_WEATHER_TEMP_F is the weather temperature outside
of the antenna cabins, and RM_AMBIENTLOAD_TEMPERATURE_F is the best measure
of the temperature inside of each antenna cabin.
Here is the usage for extracting the weather temperature from SMA Sybase:
d2o% TambSybase.csh 2005 02 18 RM\_WEATHER\_TEMP\_F
The arguments are year, month, day and name of a RM variable.
An ASCII data file (tambient.dat) is created. Then copy the
data file to one's miriad working area:
scp tambient.dat miriad@tornado.cfa.harvard.edu:/data/miriadWork/
Input:
  Task:   varfit
  vis      = ceres.221lsb,ceres.682lsb
  xaxis    = time
  yaxis    = phase
  device   = /xs
  nxy      = 2,3
  refant   = 6
  options  = phareg,tambient
The options=phareg,tambient in Miriad varfit
allows
users to do the linear correlation between the residual phase
and the ambient temperature and plot the ambient temperature
as a function of UT time. Here is a report on the screen:
Ph_rsd(yaxis) = slope * T_amb(xaxis) + intercept
ant   yaxis_ave   yaxis_rms   slope   intercept   rms-fit   correlation
1 -32.2616577   9.2522459  -5.895032  -42.4797134  9.2308187 -0.067994795
2  70.8661423  15.5836411 -24.430215   28.5204391 15.3640232 -0.167299643
3 -17.2317982  11.3366852   5.617950   -7.4940161 11.3208218  0.052884511
4  33.2323837  19.3245583  21.501709   70.5020142 19.1878548  0.118740819
5  42.4374275  11.4256554  13.781847   66.3259659 11.3305712  0.128725022
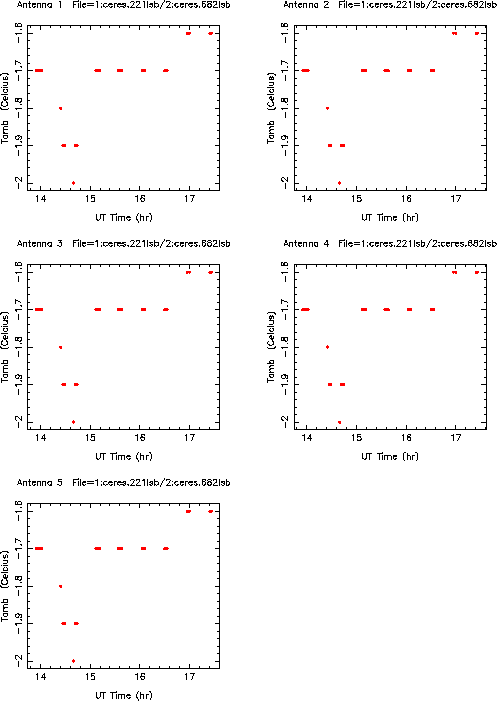
The correlation coefficients are small for all the antennas,
suggesting that the residual phase does not relate to the variation
of the weather temperature (Fig2.15):
Figure:
The weather temperature as
function of time
plotted with Miriad varfit
for each antenna.
Antenna 6 is the reference antenna. The weather temperature
data were extracted from SMA Sybase corresponding to the
observations on 2005-02-18.
 |
Next: GLUE SMA MULTI-CHUNK FILES
Up: Utility Tools
Previous: LINEAR REGRESSION BETWEEN 230/690
Jun-Hui Zhao (miriad for SMA)
2012-07-09