If several bandpass scans were included during an observing track, one could solve for the antenna-based bandpass at each scan time and then compare the solutions to check up if the bandpass on which antennas varies with time. Here is an exmaple of the observation carried out on August 1, 2005. Three data scans from the time intervals of 04:50 to 05:10 on Callisto, 08:00 to 10:15 on 3c454.3 and 10:15 to 15:00 3c454.3 can be separated using either uvsplit or uvaver:
uvaver vis=sgrb228a_rx0.lsb.tsys select='source(callisto)' \
       out=05aug1bp_1 options=nocal,nopass
uvaver vis=sgrb228a_rx0.lsb.tsys select='source(3c454.3)','time(08:00,10:15)' \
       out=05aug1bp_2 options=nocal,nopass
uvaver vis=sgrb228a_rx0.lsb.tsys select='source(3c454.3)','time(10:15,15:00)' \
       out=05aug1bp_3 options=nocal,nopass
Then solve for antenna-based bandpass for each of the time intervals
using smamfcal:
smamfcal vis=05aug1bp_1 edge=5,5  \
        weight=2 refant=3 interval=600
smamfcal vis=05aug1bp_2 edge=5,5  \
        weight=2 refant=3 interval=600
smamfcal vis=05aug1bp_3 edge=5,5  \
        weight=2 refant=3 interval=600
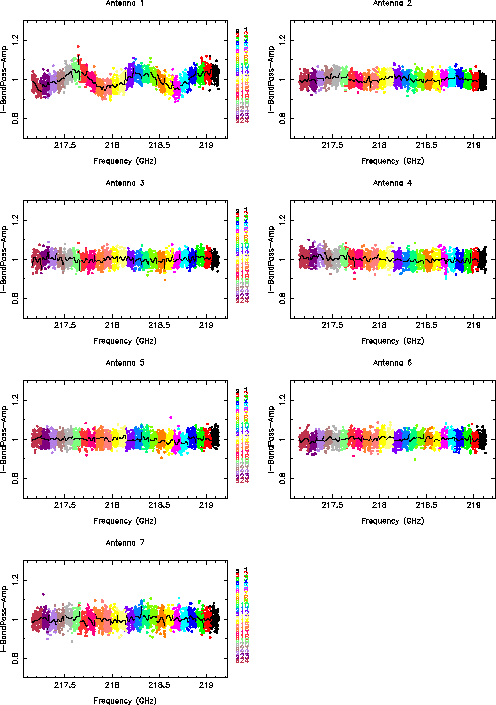
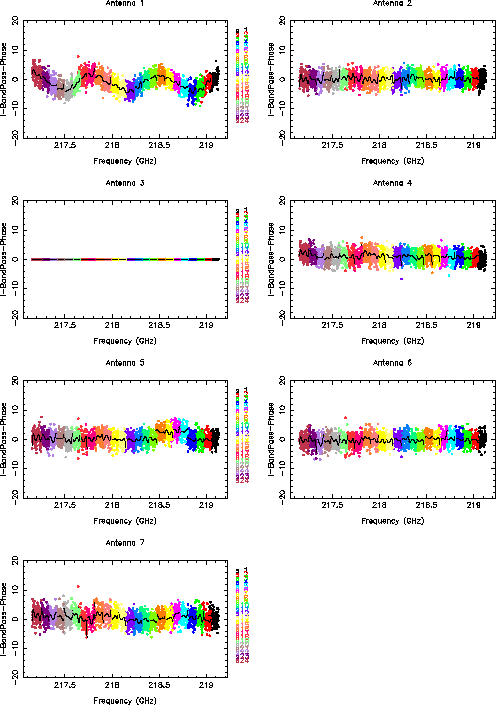
Now, one could check up whether the bandpass varies by calculating
the ratios of the bandpass solutions derived from the
time intervals at different time with smagpplt:
smagpplt vis=05aug1bp_3,05aug1bp_2 device=/xs \
        yaxis=amp \
        options=bandpass,wrap,ratio  polyfit=5 \
        nxy=2,4 yrange=0.7,1.3
sleep 1
smagpplt vis=05aug1bp_3,05aug1bp_2 device==/xs \
        yaxis=pha \
        options=bandpass,wrap,ratio  polyfit=5 \
        nxy=2,4 yrange=-20,20
The ripple on antenna 1 shows large variation across
the 2 GHz bands in both amplitude (![]() 20%, see Fig. 3.5) and
phase (15 degree, see Fig. 3.6).
20%, see Fig. 3.5) and
phase (15 degree, see Fig. 3.6).
 |
 |