


Subcontinental-Scale Crustal Velocity Changes Along the Pacific-North America Transform Plate Boundary From BARGEN GPS Data
Full citation:
Davis, J. L., Wernicke, B.L., Bisnath S., Niemi, N. A., and Elósegui, P. (2006) Subcontinental-Scale Crustal Velocity Changes Along the Pacific-North America Transform Plate Boundary From BARGEN GPS Data, Nature, 441, 1131 doi:10.1038/nature0478112/2006
Abstract
Transient tectonic deformation has long been noted within ∼100 km of plate boundary fault zones and within active volcanic regions, but it is unknown whether transient motions also occur at larger scales within plates. Relatively localized transients are known to occur as both seismic and episodic aseismic events, and are generally ascribed to motions of magma bodies, aseismic creep on faults, or elastic or viscoelastic effects associated with earthquakes. However, triggering phenomena and systematic patterns of seismic strain release at subcontinental (∼1,000 km) scale along diffuse plate boundaries have long suggested that energy transfer occurs at larger scale. Such transfer appears to occur by the interaction of stresses induced by surface wave propagation and magma or groundwater in the crust, or from large-scale stress diffusion within the oceanic mantle in the decades following clusters of great earthquakes. Here we report geodetic evidence for a coherent, subcontinental-scale change in tectonic velocity along a diffuse ∼1,000-km-wide deformation zone. Our observations are derived from continuous GPS (Global Positioning System) data collected over the past decade across the Basin and Range province, which absorbs approximately 25 per cent of Pacific–North America relative plate motion. The observed changes in site velocity define a sharp boundary near the centre of the province oriented roughly parallel to the north-northwest relative plate motion vector.We show that sites to the west of this boundary slowed relative to sites east of it by,∼1mmyr–1 starting in late 1999.
Figures
High resolution images may be obtained by clicking the link above.
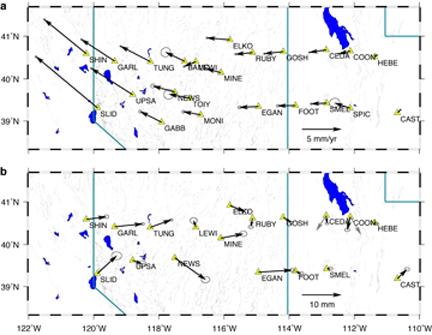
Figure 1. Sites of the northern BARGEN GPS
network.
a, Positions (triangles) and average
horizontal velocities (arrows). Error ellipses are
95% confidence (formal). Sites TOIY, BAMO,
SPIC, GABB and MONI are shown, but their time
series are too short to enable reliable
determinations of velocity changes. Solid blue
lines indicate US state boundaries. b, Deviations
from linear motion, defined as the difference
between the average position for the last year and
the position predicted from a linear fit through the
first 2.5 years of acquisition. Error ellipses are 95%
confidence based on formal uncertainties scaled
by the weighted root-mean-square residual to the
linear fit and assuming the same north-east
correlation as for the velocity estimates. The grey
arrows for CEDA and COON represent a
prediction based on a model for Great Salt Lake
loading.
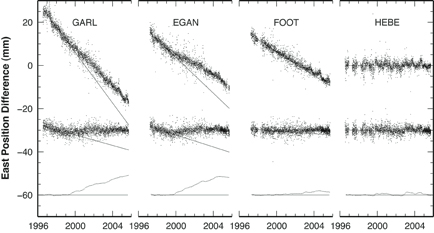
Figure 2. Illustration of the post-analysis procedure, using time series of
east position for four BARGEN sites.
Illustration of the post-analysis procedure, using time series of
east position for four BARGEN sites. Top, ‘raw’ time series, in a North
America-fixed geodetic reference frame (see Methods). Error bars are
omitted for clarity, but are generally ∼1 mm. The straight line is the best-fit
straight line using position estimates from the first 2.5 years. Middle,
residuals of the raw time series from a best-fit model consisting of a straight
line and seasonal (annual and semi-annual sinusoids) terms. A statistical
approach that allowed these terms to change with time in a constrained
manner was used (see Methods). Bottom, residuals smoothed with a
gaussian filter with a full-width at half-maximum (FWHM) of ∼8 months. A
model based on a linear fit to the first 2.5 years of data has been removed.
The evolution of these final time series thus indicates deviation from
temporally linear motion.
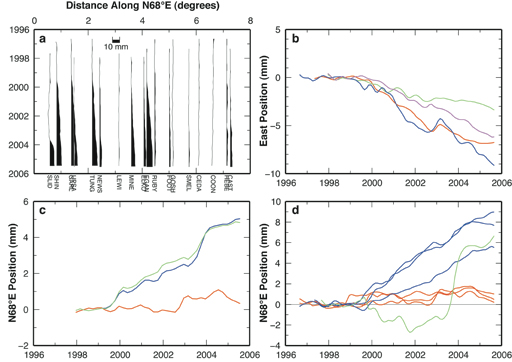
Figure 3. Analysis of spatial variation of nonlinear deviations.
a, Smoothed time series of position deviations from linear motion (see Fig. 2) in the direction N68°E, projected along a great circle with azimuth
N68°E near the centre of the network. Where these deviations are positive,
the space between the trace and zero has been shaded black (or grey, for site
UPSA, whose line lies atop that for GARL). The significant deviations occur
in the western part of the network. b, East components of intersite vectors
for EGAN—FOOT (red), ELKO—GOSH (green), GARL—HEBE (blue) and
MINE—SMEL (purple). GARL—HEBE, which spans the entire network
east–west, and EGAN—FOOT, which spans a short distance in the centre of
the network (Fig. 1), show nearly identical deviations, indicating an abrupt boundary for velocity changes in eastern Nevada. c, Regionally averaged
nonlinear deviations of N68°E position. Red, eastern BARGEN (HEBE,
FOOT, COON, CAST, CEDA, SMEL, GOSH and RUBY). Green, central/
western BARGEN (MINE, TUNG, ELKO, EGAN, LEWI, NEWS, GARL,
UPSA and SHIN). Blue, same as green plus SLID. Only data from a common
epoch range (1997.86—2005.18) were used. The figure demonstrates that
the velocity change has moved the western part of the network, on average,
3–4mm eastward or northeastward compared to the eastern part of the
network. d, N68°E position time series for three groups of sites. Red, eastern
sites RUBY, FOOTand HEBE. Blue, western sites EGAN, MINE and GARL.
Green, site SLID.
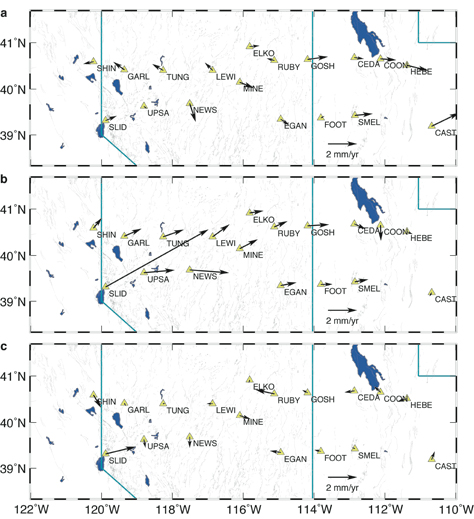
Figure 4. Differences of horizontal velocity for one-year periods relative to the average velocities for the period 1997.0–2002.0.
a, Differences for the calendar year 2002. b, 2003. c, 2004. 1σ errors for each component are ∼0.4mmyr–1.
Acknowledgements:
This work was supported by the National Science Foundation and the US Department of Energy. UNAVCO, Inc., supports BARGEN site implementation, operation and maintenance. The authors thank R. Bürgmann for comments on the manuscript.
For questions or comments on web site contact: Geodesy Webmaster
Document URL: lweb.cfa.harvard.edu/space_geodesy/SCIENCE/2006/SubcontinentalScaleCrustalVelocityChanges/index.html
Last Modified: Monday, 22-Jan-2007 14:42:12 EST