


Step-wise changes in glacier flow speed coincide with calving and
glacial earthquakes at Helheim Glacier, Greenland
Full citation:
glacial earthquakes at Helheim Glacier, Greenland
Nettles, M., T. B. Larsen, P. Elósegui, G. S. Hamilton, L. A. Stearns, A. P. Ahlstrøm, J. L. Davis, M. L. Andersen, J. de Juan, S. A. Khan, L. Stenseng, G. Ekström, and R. Forsberg (2008), Step-wise changes in glacier flow speed coincide with calving and glacial earthquakes at Helheim Glacier, Greenland, Geophys. Res. Lett., 35, L24503, doi:10.1029/2008GL036127.
Abstract
Geodetic observations show several large, sudden increases in flow speed at Helheim Glacier, one of Greenland’s largest outlet glaciers, during summer, 2007. These step-like accelerations, detected along the length of the glacier, coincide with teleseismically detected glacial earthquakes and major iceberg calving events. No coseismic offset in the position of the glacier surface is observed; instead, modest tsunamis associated with the glacial earthquakes implicate glacier calving in the seismogenic process. Our results link changes in glacier velocity directly to calving-front behavior at Greenland’s largest outlet glaciers, on timescales as short as minutes to hours, and clarify the mechanism by which glacial earthquakes occur.
Figures
High resolution images may be obtained by clicking the link above.
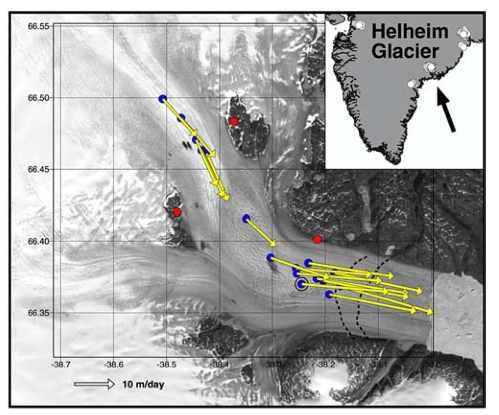
Figure 1.
Southern Greenland, with locations of glacial earthquakes; arrow marks Helheim Glacier (inset). Geometry of GPS network at Helheim Glacier during summer, 2007, overlain on a 2001 LANDSAT image. The position of the calving front at two times during the summer of 2007 is shown by the black dotted lines (easternmost line, July 4; westernmost line, August 15). Blue dots, locations of GPS stations on the glacier surface at the time of deployment; black ring shows station IS38 (Figure 3). Red dots, locations of rock-based reference stations. Yellow arrows show average station velocities determined over the duration of station deployment; white arrow shows scale.
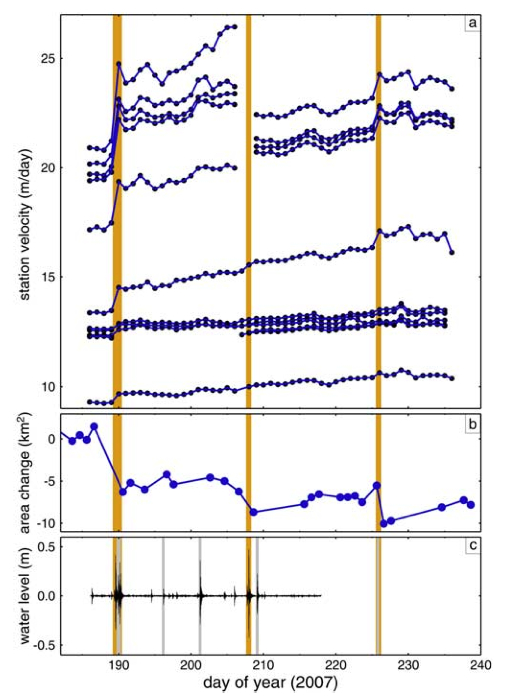
Figure 2.
(a) Average daily along-flow speed for GPS stations on the surface of Helheim Glacier. The stations advect with the glacier ice, explaining the gradual upward trend in velocity. (b) Cumulative change in glacier area with respect to total area on day 180. Rapid changes towards more negative values indicate large calving events. (c) Short-period (200--4000 s) variations in water height near the end of the Helheim fjord with respect to the average water level. Times of large glacial earthquakes are indicated by orange bars (three events on days 189--190, one event on day 207, one event on day 225); smaller earthquakes are indicated by gray bars.
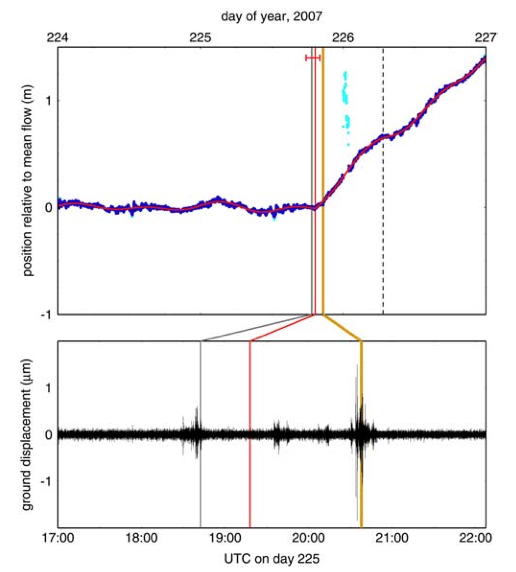
Figure 3.
(top) Horizontal displacement of GPS station IS38 (Figure 1) over a period of three days. Blue dots show station position, estimated every 15 s, with respect to position expected for a mean along-flow speed of 21.7 m/day. Cyan dots indicate 4-σ outliers, associated mainly with the day boundary and not believed to represent geophysical signal. The glacier accelerates to 23.0 m/day near the end of day 225 (vertical red bar), and slows to 22.7 m/day ˜12 hr later (dashed black line). Horizontal red bar shows estimated uncertainty in acceleration time. Red curve, predicted station position for the model used to estimate time of glacier speedup. Orange and gray bars show times of large and small glacial earthquakes. (bottom) Displacement seismogram (0.5– &n-dash;3 s) recorded 100 km from Helheim Glacier.
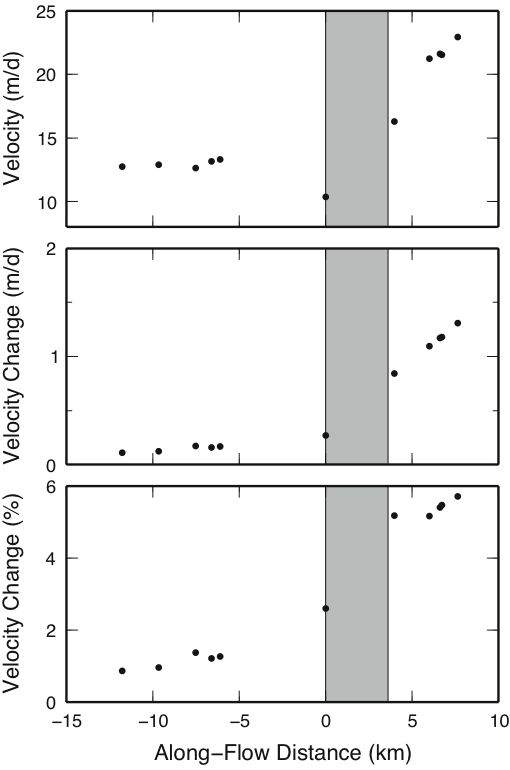
Figure S1.
Change in glacier speed with respect to position of GPS station along the glacier for the speedup event occurring on day of year 225.
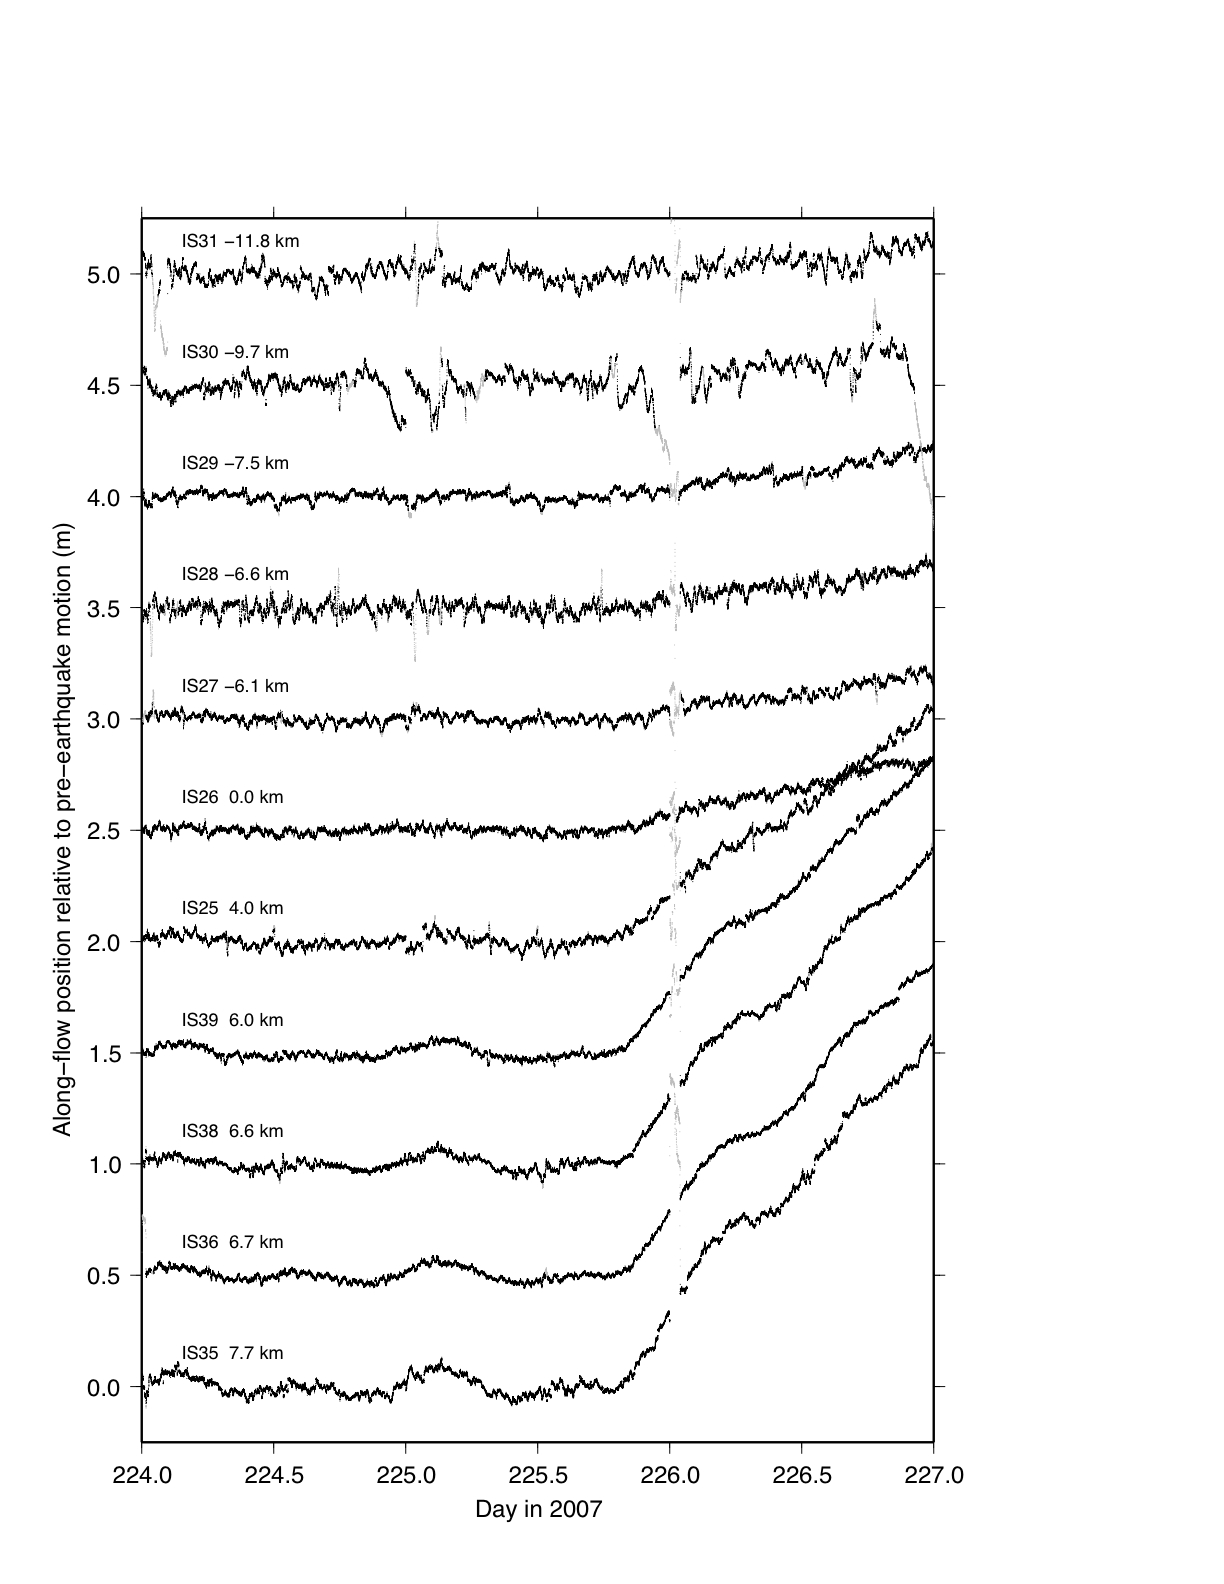
Figure S2.
Displacement of all network stations for the same three-day period as in Figure 3.
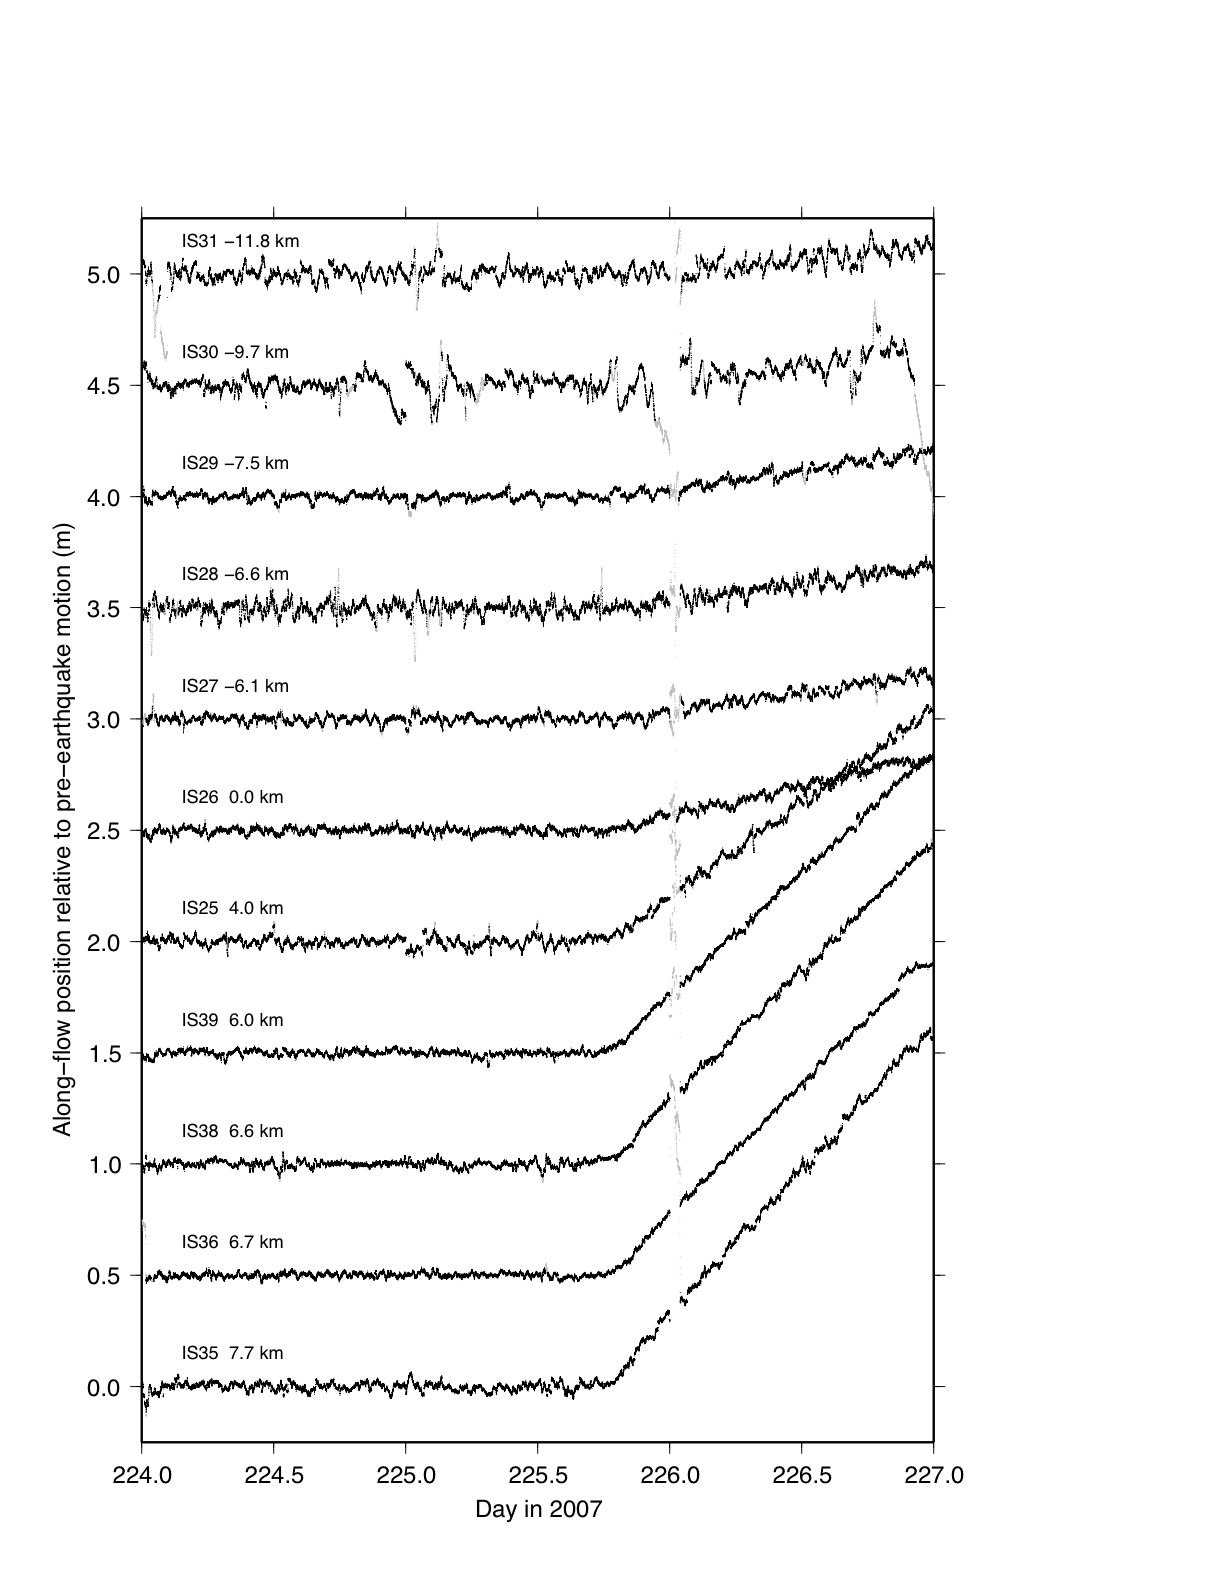
Figure S3.
Same as Figure S2, but the diurnal and semidiurnal components have been removed.