USER GUIDE FOR IDL-BASED SOFTWARE
DAS.PRO 6/27/2001 - code version: das40.pro, ext33.pro
NOTE: Please go here
http://www.cfa.harvard.edu/uvcs/get_involved/das51_news.html
or see the file das51_news.html in the DPS/DOCS/ subdirectory for the latest
updates and added features for DAS51.
![]()
INTRODUCTION
The purpose of the Data Analysis
Software (DAS.PRO) is to perform calibration, display and analysis of the
UVCS Science Data. It also performs catalog functions. The DAS.PRO is written
in the Interactive Data Language (IDL), and consists of Basic software
(including Catalog), contained in the file "das.pro" or higher versions
(das**.pro), and Extension software, contained in the file "ext.pro" or
higher versions (ext**.pro). At the present status of development the Catalog
part consists in a preliminary draft. The inputs and the outputs for the
Basic part are Spectral or Visible Light Data Files (SPVL), for the Extension
part are Image or Synoptic Data Files. All files are in FITS format.
![]()
STARTING
THE CODE
To start the IDL from the
UNIX prompt type: "idl {Return}". To compile the code from the IDL prompt
[i.e. IDL>] type: "@das {Return}". The IDL compiles all the procedures/modules
present in the files "das**.pro" and "ext**.pro". Bring up the DAS software
interface by typing "mn {Return}". The MAIN window appears.
SSW USERS: If you are running under SSW, you must run the DAS in its "DPS"
directory just as if you were running it outside of SSW. The easiest way to do
this is "cd $SSW_UVCS/DPS" from your unix prompt before entering "sswidl".
![]()
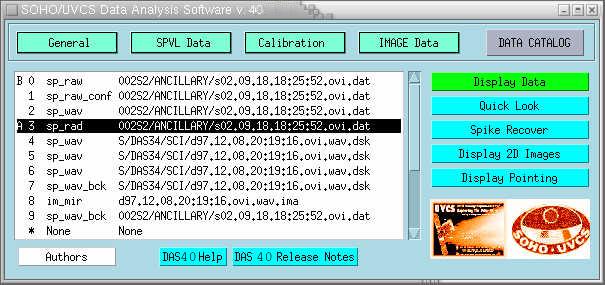
GENERAL
INFORMATION
The software has the ability to manipulate
up to ten SPVL/Image/Synoptic Data Sets. The letter "A" and the 'black
strip' in the Data Sets box are pointers that indicate the currently active
Data Set (0-9). All the functions that operate on one Data Set only will
be applied to the active Data Set "A". The functions that operate on a
couple of Data Sets will be applied to the Data Set "A" and "B". If the
code break for any reason during the execution (e.g. appear the IDL> prompt
in the UNIX window from which the code was started), most of the times
it is enought to type "x {Return}" from the IDL prompt in order to restart
the code and continue the execution. If you select the "Quit" button from
the "General" pull-down menu you go to the IDL> prompt. Type "r {Return}"
to restart to work on the code. The procedures/functions listed in the
menus but not listed in this file are not yet implemented.
![]()
PULL DOWN BUTTONS
 CLEAR DATA
SET
CLEAR DATA
SET
To clear the contents of a Data Set, select it as "A" clicking over it on the Data Set box, then press "Clear Data Set A" from the "General" pull-down menu.
COPY DATA
SET
To copy data from one Data Set to another, select the Data Set from which the data will be copied clicking over it on the Data Set box, then select the Data Set in which you want the data will be copied. Then press "Copy Data Set B in A", from the "General" pull-down menu.
SELECT COLOR
TABLE
To change the color table for Display purpose, press "Select Color Table" in the "General" pull-down menu and select one of the listed color tables.
PRINTER
SETUP
To provide a printer's name, select "Printer Setup" from the "General" pull-down menu and type the printer's name in the space provided for inputs in the pop-up window.
IDL COMMAND
To execute IDL command while the code is running, select "IDL Command" from the "General" pull-down menu and type IDL commands in the space provided for inputs in the pop-up window, exactly as at the IDL prompt level. For outputs resulting from the commands, refer to the UNIX window from which the code was started.
DAS.PRO
HELP
To look at this file in a window during the execution of the code, press the "Help" button from the "General" pull-down menu.
QUIT THE
CODE
To exit the code, select "Quit" from
the "General" pull-down menu. This destroys the IDL widgets interface
but not the content of the Data Sets.
READ SPVL
FITS FILE
To read a Spectral or a VL Data file, press the "Read Spectral & VL Data File" button in the "SPVL Data" pull-down menu, type the correct path of the file in the 'Path' space provided, than choose between the files listed in the pop-up menu. The selected file is read and automatically stored in the active Data Set "A". After reading a file the file name and the 'calibration status' of the data are shown in the Data Sets box. If the Spectral or VL Data files are stored on disk on 'compress' format (i.e. *.Z), the code has the capability to 'uncompress' and read them automatically.
SAVE SPVL
FITS FILES
To write out a SPVL Data file, press the "Write Spectral & VL Data File" button in the "SPVL Data" pull-down menu. Then type the path and the optional extension, and press the "WRITE" button or "CANCEL" the operation. The contents of the active Data Set "A" is saved in FITS format.
SHOW SPVL
KEYWORDS AND CONFIGURATION
To display the values of the Keywords and of the Configuration Parameters associated with the active Data Set "A", press "Show Keywords & Configuration" button from the "SPVL Data" pull-down menu. Note that the Configuration Parameters are functions of the exposure slider index selected in the pop-up window.
SHOW
EXTENDED KEYWORDS
To display the values of the extended Keywords associated with the active Data Set "A", press "Show Extended Keywords" button from the "SPVL Data" pull-down menu. For a detailed description and example of the extended keywords one should refer to the help file (das40.html) in ../DOCS area.
COMBINE
OR DELETE SPECTRAL EXPOSURES
To combine or delete certain exposures in the active Data Set "A", select "Combine/Delete Exposures" from the "SPVL Data" pull-down menu. This opens the pop-up window associated with this operation. Select the exposure(s) to be summed or deleted by clicking over it (them) on the list provided. Then select "Combine" or "Delete" option. It is possible to combine automatically the exposures by the same value of mirror position, clicking the "Combine MIRPOS" button. The results of the requested operation will be showed in the exposures list and in the bottom of the pop-up window. Confirm with "Done" button or "Cancel" the operation.
MODIFY OR
DELETE SPECTRAL PANELS
To modify or delete panels in the active Data Set "A", select "Modify/Delete Panels" from the "SPVL Data" pull-down menu. To modify row parameters write the new values in the spaces provided and then press the "MOD" button. Note that the changes will be apply to ALL panels. To modify column parameters, first select the panel by clicking over it on the list provided, then write the new values in the spaces provided and press "EXT" button, in order to extract the new modified panel. To delete one of the Panels click over it on the list provided and press the "Delete Panel" button. Each operation needs to be confirmed or aborted with "Done" or "Cancel" button.
CONCATENATE
SPVL DATA SETS
To concatenate different Data Sets
select them as "B" and "A", and then press the "Concatenate Data Sets"
button from the "SPVL Data" pull-down menu. If the data allows to be combined,
the result will be stored in the active Data Set "A".
PERFORM
SPVL INSTRUMENT CONFIGURATION CALIBRATION
To perform the Instrument Configuration Calibration to the active Data Set "A" (it must be in the 'sp_raw' or 'vl_raw' status) select "Perform SPVL Configuration Calibration" button in the "Calibration" pull-down menu, type the correct path of the file in the 'Path' space provided, and than choose between the calibration files listed in the pop-up menu. The instrument configuration will be automatically applied to the Data Set "A" and the 'status' column in the Data Sets box will be update to the new status of calibration of the data.
PERFORM
VL pB COMPUTATION
This feature has been disabled.
To compute the values of the Polarized Brightness (pB) of the active Data
Set "A" (it must be in the 'vl_raw_conf' status) select "Perform VL pB
Computation" button in the "Calibration" pull-down menu. The data will be
automatically combined by polpos (checking if the mirpos are equal), then
the data belonging to a complete cycle will be used to compute the pB values
(VL Radiometric Calibration). Uncomplete cycles will be deleted. The computed
values and associate errors will be automatically stored in the Data Set "A"
and the 'status' column in the Data Sets box will be update to the new status
of calibration of the data. NOTE: Currently this feature have been disabled
due to the fact that the work on the Visible Light channel calibration is
still in progress. For further information please contact Marco Romoli
(romoli@arcetri.astro.it)
Work on the Visible Light channel calibration is still in progress.
For further information please contact:
Marco Romoli (romoli@arcetri.astro.it)
PERFORM
SPECTRAL WAVELENGTH CALIBRATION
To perform the Wavelength Calibration to the active Data Set "A", select "Perform SP Wavelength Calibration" button in the "Calibration" pull-down menu. The wavelength calibration will be automatically applied to the Data Set "A" and the 'status' column in the Data Sets box will be update to the new status of calibration of the data.
PERFORM
SPECTRAL RADIOMETRIC CALIBRATION
To perform the Radiometric Calibration to the active Data Set "A", select "Perform SPVL Radiometric Calibration" button in the "Calibration" pull-down menu. The radiometric calibration will be automatically applied to the Data Set "A" and the 'status' column in the Data Sets box will be update to the new status of calibration of the data. Note that the Radiometric Calibration for the 'O VI channel' requires the identification of the redundant panel(s) by the user.
STRAY LIGHT HELP
Currently, the user subtracts stray light based on laboratory and flight data.Please see the plot "straylight.ps" in the DOCS folder for more information.
REDUNDANT PATH VIGNETTING HELP
Because of the geometry of the secondary mirror, light from the UVCS
redundant path only fully illuminates a portion of the detector.
The effective redundant area varies both by detector pixel and by
unocculted mirror aperture. It is not meaningful to perform a
redundant path radiometric calibration in a portion of the detector
receiving no redundant light, and the calibration becomes more
uncertain in the partially vignetted zone.
DAS 33 correctly performs the radiometric calibration in regions where
it is valid, and provides the user with a saveable list of regions in which
the calibration could not be performed or had high uncertainty.
To display the values of the Keywords
and of the Configuration Parameters associated with the active Data Set
"A", press "Show SPVL Keywords & Configuration" button from the "Calibration"
pull-down menu. Note that the Configuration Parameters are functions of
the exposure slider index selected in the pop-up window.
To display the values of the Calibration
Parameters associated to the active Data Set "A", select "Show SPVL Calibration
Parameters" button from the "Calibration" pull-down menu.
To read a Dark Count or a Flat Field
Data file, press the "Read Dark Count File" or "Read Flat Field File" button
in the "Calibration" pull-down menu, type the correct path of the file
in the 'Path' space provided, and than choose between the files listed
in the pop-up menu. The selected file is read and automatically stored
in the active Data Set "A".
To perform the Dark Count subtraction
to the active Data Set "A", select the "Perform Dark Count Correction"
button in the "Calibration" pull-down menu. The operation can be done only
if at least one Dark Count Data file has been previously stored in the
Data Set "B". The status of calibration of the data contained in the Data
Set "A" must be consistent with the operation requested.
To perform the Flat Field calibration
to the active Data Set "A", select the "Perform Flat Field Correction"
button in the "Calibration" pull-down menu. The operation can be done only
if at least one Flat Field Data file has been previously stored in the
Data Set "B". The status of calibration of the data contained in the Data
Set "A" must be consistent with the operation requested.
Flatfield measurements have been made both pre-flight and on-orbit. We
estimate:
+/- 10% pixel-to-pixel variation for Ly-alpha detector (one sigma) To write out a Dark Count or a Flat
Field Data file, press the "Write Dark Count File" or "Write Flat Field
File" button in the "Calibration" pull-down menu. Then type the path and
the optional extension, and press the "WRITE" button or "CANCEL" the operation.
SHOW SPVL
KEYWORDS AND CONFIGURATION
SHOW SPVL
CALIBRATION PARAMETERS
READ DARK
OR FLAT FITS FILE
PERFORM
DARK COUNT SPECTRAL CORRECTION
PERFORM FLAT
FIELD SPECTRAL CORRECTION
FLAT FIELD HELP
and +/- 5% pixel-to-pixel variation for OVI detector.
Given the magnitude of other uncertainties involved in UVCS radiometry,
we believe that for most analyses, flat fielding the data is not
necessary. Each detector has one or two obvious defects where the
detection efficiency approaches zero. We recommend simply ignoring
the data in these regions.SAVE DARK
OR FLAT FITS FILE
READ IMAGE
OR SYNOPTIC FITS FILE
To read an Image or Synoptic Data file, press the "Read Image Data File" button in the "IMAGE Data" pull-down menu, type the correct path of the file in the 'Path' space provided, than choose between the files listed in the pop-up menu. The selected file is read and automatically stored in the active Data Set "A". After reading a file the file name and the 'calibration status' of the data are shown in the Data Sets box. If the Image or Synoptic Data files are stored on disk on 'compress' format (i.e. *.Z), the code has the capability to 'uncompress' and read them automatically.
SAVE IMAGE
OR SYNOPTIC FITS FILE
To write out an Image or Synoptic Data file, press the "Write Image Data File" button in the "IMAGE Data" pull-down menu. Then type the path and the optional extension, and press the "WRITE" button or "CANCEL" the operation. The contents of the active Data Set "A" is saved in FITS format.
SHOW IMAGE
KEYWORDS
To display the values of the Keywords and of the Parameters associated with the active Data Set "A", press "Show Keywords" button from the "IMAGE Data" pull-down menu. Note that the Image Parameters are functions of the image slider index selected in the pop-up window.
MAKE CORONAL
IMAGE
To produce a Coronal Image select
by mouse in the Data Set box a Data Set containing a Spectral data in the
proper status of calibration ('sp_rad'), then select an empty Data Set
as "A" and press the "Make Image" option from the "IMAGE Data" pull-down
menu. The 'Make Images' pop-up window with the list of the default images
ready to be built appear. Select any images you want modify clicking over
it on the list provided and select the wavelength range for the interest
interval typing the values in the spaces provided or clicking on the "Mouse"
button. This operation brings up the 'Integrated Spectrum' pop-up window
that allows to select a more confined wavelength range around the line
profile interested. When a desirable wavelength range has been selected,
click on the "Done" button which will return control to the original pop-up
window. Select the kind of image by the 'Image type' buttons and select
between interpolated or not interpolated image. Click over the "Copy /
Modify" button to add the 'trimmed' data to the list of images. Delete
any unwanted image clicking over it on the list provided and pressing the
"Delete" button. Process the images by pressing the "Done" button or "Cancel"
the operation. The Coronal Images will be stored in the active Data Set
"A". MAKE SYNOPTIC IMAGE To produce one Synoptic Coronal Image will be
necessary to have built the eight Single Coronal Images that correspond
to the eight positions at which either Lyman-alpha or O VI were observed,
and have been stored them into eight Data Sets. Select now an empty Data
Set as "A", and press the "Make Synoptic" option from the "IMAGE Data"
pull-down menu. The composite Synoptic Image will be stored in the active
Data Set "A".
Due to the preliminary status of
the Catalog software the Help features of the functions related are not
yet implemented.
DISPLAY
DATA
To display the data contained in
the Data Set "A", press the "Display Data Set A" button in the DAS main
window. This opens the Display window associated with the active Data Set.
What the Display window shows depends by the data status. Spectral Data
- For Spectral data, before Wavelength Calibration, the Display window
shows one selected exposure at a time, both as an image of counts per pixels
group (for all Panels) and as histograms of count versus Row group index
and count versus Column group index (for one selected Panel). After Wavelength
Calibration, the Display window shows the data for one selected exposure,
both as an image of counts per bin (for all Panels) and as histograms of
count versus wavelength index and count versus slit position (for one selected
Panel). After Radiometric Calibration, the Display window shows the data
for one selected exposure, both as an image of intensity per bin (for all
Panels) and as histograms of intensity versus wavelength index and intensity
versus slit position (for one selected Panel). To select a different exposure
use the "Exposure ID {index}" slider. Both the spectral image and the histograms
are updated. To select a different Panel use the "Panel ID {index}" slider.
This causes both histograms to be updated. To select different Row/Column
Group indices or Wavelength/slit Position indices for the histograms, use
the "Row Group ID {index}"/"Column Group ID {index}" or "Wavelength ID
{index}"/"Position ID {index}" sliders. It is possible to quickly select
by mouse a point over the Image, and all the histograms and the related
sliders on the Display window are update to the new values. Clicking the
other buttons above the "Exposure ID {index}" slider allows to show a few
informations about some important parameters related to the spectral data.
Visible Data - Before Radiometric Calibration, the Display window shows
the values of the main VL data parameters, listed by the (sub)exposures
index. After Radiometric Calibration, the Display window also shows the
values of the Polarized Brightness of the Corona, and the corresponding
errors. Select "Save on ASCII File" button in Display window in order to
save some main parameters values into ASCII format. Image Data - For Coronal
Image Data, the Display window shows one selected image at a time, and
the related histograms. To select a different image use the "Image ID {index}"
slider. Both the image and the histograms will be updated. It is possible
to quickly select by mouse a point over the Image, and all the histograms
and the related sliders on the Display window are update to the new values.
Clicking the other buttons above the "Image ID {index}" slider allows to
performs some operations over the image, as apply some kind of radial filter,
a different smooth operations and allows to apply different contour levels
to the image. The "INFO" button show a few informations about the Data
Set and about the image. For Synoptic Image Data, the Display window shows
the composite image of the entire corona, obtained from the single coronal
images. To close the Display window press the "QUIT" button.
ALL EXPOSURE
SPECTRAL QUICK LOOK
To see all the spectral exposure together of the active Data Set "A" select "All Exposures Quick Look" button in the DAS main window.
SPECTRAL
SPIKE RECOVER
To recover an exposure containing
a spike in the active Data Set "A" select the "Quick Look & Spike Recover"
button in the DAS main window. Using the vertical slider check all the
exposures, and using the "Exposure ID {index}" slider load the alterated
image in the 'Selected Exposure' window in the right part of the Quick
Look & Spike Recover Display Window. Then can cut out data above a
certain level of intensity to recover the data using the "Recover" option.
The default intensity level is 200.000, but a level of 2000.000 is recommended
for spikes occurring in the Lyman-alpha observations, and a level between
1000.000 and 2000.000 is recommended for observations of O VI, but of course
the appropriate level will vary depending on the strength of the spike.
Press "OK" in the 'Spike Recovered' pop-up window in order to apply the
correction to the data, or select "Back" in order to change the spike level
typed in the space provided. DATA HISTOGRAM HARDCOPY To obtain a hardcopy
of the histograms currently showed in the Spectral or Image Display window
select over the "Hardcopy" pull-down menu in the Display window the output
requested. The outputs are PostScript files named 'idl.ps', which must
be sent to the printer (using the UNIX command "lpr"). REFERENCES For more
details about the Data Analysis Software Basic (Spectral Code) requirements
see 'Data Processing Software Requirements for the Ultraviolet Coronagraph
Spectrometer'.