


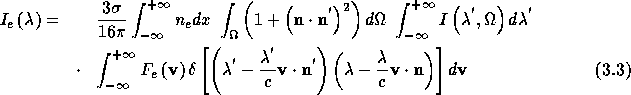
The spectral line intensity of the resonantly scattered Ly- profile is given by (e.g. Withbroe, 1982b):

Here h, c,  , and R are Planck's constant, the velocity of light,
the Einstein coefficient, and the ratio of the neutral hydrogen to proton
density,
, and R are Planck's constant, the velocity of light,
the Einstein coefficient, and the ratio of the neutral hydrogen to proton
density, , respectively. (CGS units are used).
It is assumed that the plasma is fully ionized with 10% helium,
, respectively. (CGS units are used).
It is assumed that the plasma is fully ionized with 10% helium,  =
0.8. The quantity
=
0.8. The quantity  is the central wavelength of the Ly-
 scattering transition(1216Å = 2.466
 ), and I(
 )is the intensity of the chromospheric disk radiation at wavelength
 and angle
  . The observer's line of sight is in the
x direction, n and
. The observer's line of sight is in the
x direction, n and  are the unit vectors in the
direction of the observer and the incident radiation. The delta functions
transform the wavelength to the frame of the observer.
The function
are the unit vectors in the
direction of the observer and the incident radiation. The delta functions
transform the wavelength to the frame of the observer.
The function  ( v) is the velocity distribution of the scattering
hydrogen atoms which is assumed to be
Maxwellian. The factor
( v) is the velocity distribution of the scattering
hydrogen atoms which is assumed to be
Maxwellian. The factor  describes the angular dependence of the
Ly-
describes the angular dependence of the
Ly- scattering process (House, 1970; Beckers and Chipman, 1974;
Noci et al., 1987).
scattering process (House, 1970; Beckers and Chipman, 1974;
Noci et al., 1987).
The ionization equilibrium for the neutral hydrogen is calculated for any
given temperature using data given by Gabriel (1971). The
intensity of the incident radiation and the shape of the disk profile are
assumed to be constant across the solar disk. The intensity is taken to be


 (Vidal-Madjar, 1977), the disk profile is calculated from a measured
profile given by Gouttebroze et al. (1978).
(Vidal-Madjar, 1977), the disk profile is calculated from a measured
profile given by Gouttebroze et al. (1978).
The expression for the resonantly scattered component of the O VI lines are
identical to Equation (1), except that the product  R is replaced by
 , where
  and
and  are
the elemental abundance and the ionization balance for O VI respectively.
The function describing the angular dependence of the scattering process is
slightly different for the 1038 and 1032 lines, but is in both cases close
to
are
the elemental abundance and the ionization balance for O VI respectively.
The function describing the angular dependence of the scattering process is
slightly different for the 1038 and 1032 lines, but is in both cases close
to  (Noci et al., 1987).
For the collisionally excited lines we have used the expression(Withbroe, et al., 1982b):

Where CG units are used as in the rest of this chapter.
Here f, g, and E are the oscillator strength,
the mean gaunt factor and the excitation energy (in eV). The coronal emission
line profile,  , is assumed to be
Gaussian. The atomic data used for the O VI lines are given in Table 1.
The Gaunt
factors and ion equilibrium values are interpolated for any given temperature.
, is assumed to be
Gaussian. The atomic data used for the O VI lines are given in Table 1.
The Gaunt
factors and ion equilibrium values are interpolated for any given temperature.
The electron scattered Ly- line is finally calculated from:
where  is the Thomson cross section,
  the distribution function of the electrons, also assumed to be Maxwellian, and the other symbols are
as defined above.
the distribution function of the electrons, also assumed to be Maxwellian, and the other symbols are
as defined above.
Recommended atomic rates and other parameters are given in Chapter 8. These may differ by modest amounts from the values used for the predicted intensities in this chapter, which were generally taken from Gabriel (1971) and Noci et al. (1987).