A Brief Explanation of the Results Pages
This is only a simple introduction to the results pages.
For a much deeper investigation of these results click here.
The Spectral Correlation Functions
The SCF function is actually four distinct functions which examine different aspects of spectral similaity. The spectra are either scaled by a factor "s" and/or shifted by a lag "l" so that the correlation is maximized. Fixing one or both of these factors, defines the different correlation functions.
| Function/ Parameter | s value | l value | Description |
| S | Float | Float | Compares shapes of spectra |
| Sl | 1 | Float | Emphasizes similarity in shape and amplitude |
| Ss | Float | s | Highlights similarity in velocity offset and shape |
| S0 | 1 | 0 | Measures similarity in all properties |
| l | Float | Float | The lag values for the correlation function "S" |
| ll | 1 | Float | The lag values for the correlation function "Sl" |
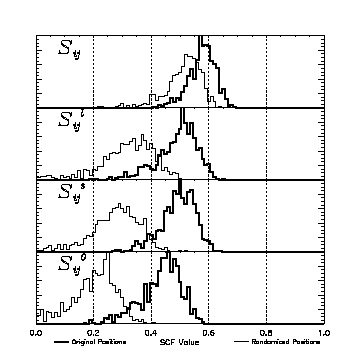
Histograms
| |
The histograms presented here are the distributions of each of the correlation functions sampled over the data set (heavy lines). If maps are available, they display the same data in their original locations. The histograms also have the correlation values for the data sets with the spectral positions randomized shown in by the light line. The correlation data tend to shift to lower values when the positions are randomized, demonstrating the significance of the original positions. The degree of this shift is related to the correlation of the original spectra. |
Statistical Analyses
|
The histograms of values are supplemented by a moment analysis of the SCF values for a data set. This analysis is performed for both the originial positions and the randomized positions. In each of the tables, the first four moments of each set of parameter values are displayed. Of particular note is the change in means associated with the randomization of the spectra which is displayed on the general Results page. |
Maps of the SCF
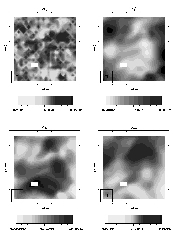 |
The final result from each of the SCF analyses is the generation of maps of the correlation function. Included in each JPEG are four maps. The upper-left hand corner is the correlation function "S" (with both compensatory parameters turned on). In the upper-right hand corner is the antenna temperature map, the lower-left contains the line width and the lower-right contains the map of the velocity centroid. |