Results from Falgarone et al.
This cube was originally discussed in Falgarone et al. (1994) and was given to the SCF project for analysis by Derek Lis. Our thanks to Dr. Lis for his great help in the SCF project.
Click for EPS format.
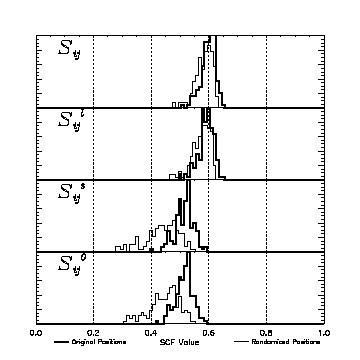
| Falgarone et al. | Real Data | Randomized Data | ||||||
| Parameter | Mean | Std. Deviation | Skewness | Kurtosis | Mean | Std. Deviation | Skewness | Kurtosis |
| S | 0.602 | 0.0253 | -0.711 | 0.477 | 0.588 | 0.0308 | -1.03 | 1.14 |
| Sl | 0.595 | 0.0264 | -0.819 | 0.774 | 0.578 | 0.033 | -1.01 | 0.841 |
| Ss | 0.519 | 0.0321 | -0.457 | 0.323 | 0.441 | 0.0603 | -0.689 | -0.0209 |
| S0 | 0.52 | 0.0297 | -0.298 | 0.0461 | 0.451 | 0.0523 | -0.551 | -0.174 |
| l | 26.8 | 579 | -0.0792 | -0.198 | -5.95 | 1310 | -0.132 | -0.659 |
| ll | 27.9 | 577 | -0.0718 | -0.198 | -5.59 | 1300 | -0.13 | -0.666 |
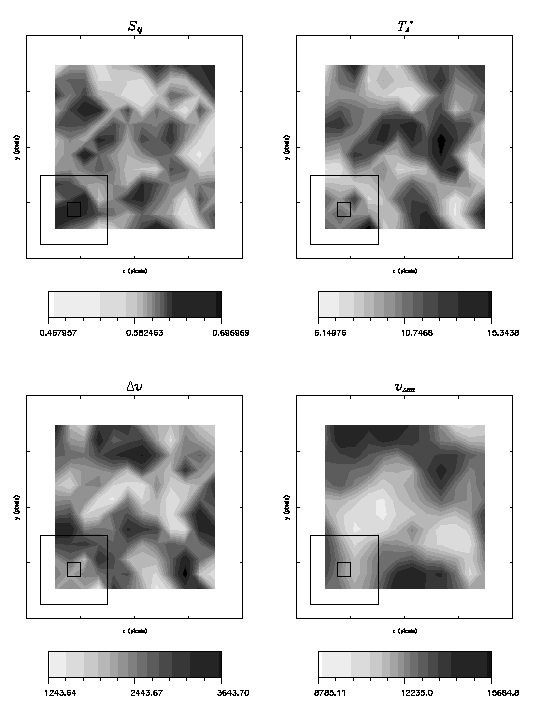
Click here for maps generated by the SCF analysis of this simulated data cube.
For an explanation of the symbols used and the data in the results page click here.
Back to SCF Home Page