SCF Analysis for L1512
The data provided are from the IRAM KEY project. The data cubes are available on the web and the first results presented using the data sets can be found in Falgarone et al. (1998).
Click here for EPS Format
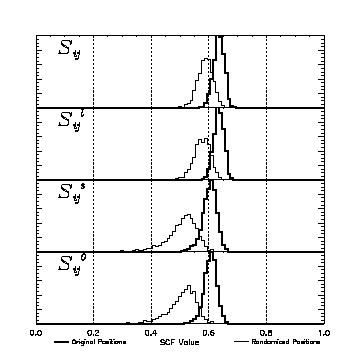
| L1512 | Real Data | Randomized Data | ||||||
| Parameter | Mean | Std. Deviation | Skewness | Kurtosis | Mean | Std. Deviation | Skewness | Kurtosis |
| S | 0.64 | 0.019 | -0.254 | 0.614 | 0.593 | 0.0269 | -0.337 | 0.302 |
| Sl | 0.639 | 0.0177 | -0.184 | 0.556 | 0.581 | 0.0306 | -0.748 | 1.88 |
| Ss | 0.607 | 0.0256 | -0.699 | 1.81 | 0.51 | 0.0566 | -1.3 | 2.9 |
| S0 | 0.61 | 0.0231 | -0.61 | 1.44 | 0.512 | 0.0518 | -1.14 | 2.14 |
| l | 0.347 | 44.1 | -0.281 | 0.995 | 0.302 | 124 | 0.574 | 0.324 |
| ll | 0.355 | 44.2 | -0.275 | 0.985 | 0.826 | 125 | 0.566 | 0.317 |
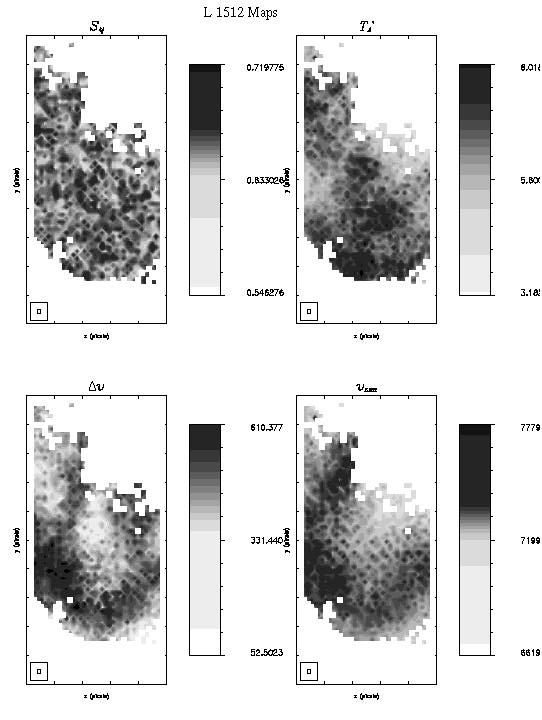
Click here for SCF maps of the L1512 observations.
For an explanation of the symbols used and the data in the results page click here.
Back to SCF Home Page