Results from the Mac Low et al. Analysis
This data cube was available on the web and is one of the cubes dicussed in Mac Low et al. (1998).
Click for EPS format
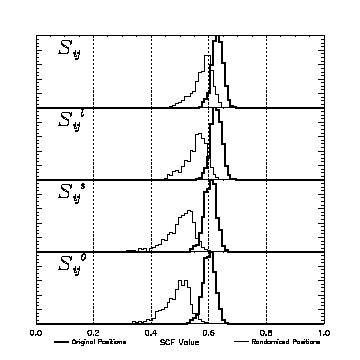
| Mac Low et al. Simulation | Real Data | Randomized Data | ||||||
| Parameter | Mean | Std. Deviation | Skewness | Kurtosis | Mean | Std. Deviation | Skewness | Kurtosis |
| S | 0.635 | 0.019 | -0.132 | 0.0903 | 0.584 | 0.034 | -0.748 | 0.243 |
| Sl | 0.631 | 0.0194 | -0.186 | 0.132 | 0.561 | 0.0363 | -0.663 | 0.0311 |
| Ss | 0.609 | 0.0217 | -0.272 | 0.062 | 0.507 | 0.049 | -1.05 | 1.37 |
| S0 | 0.606 | 0.0218 | -0.286 | 0.0363 | 0.495 | 0.0455 | -0.753 | 0.683 |
| l | -0.00000838 | 0.000761 | 0.175 | 0.697 | 0.0000435 | 0.00362 | 0.306 | 0.317 |
| ll | -0.0000111 | 0.000758 | 0.178 | 0.728 | 0.0000362 | 0.00361 | 0.296 | 0.303 |
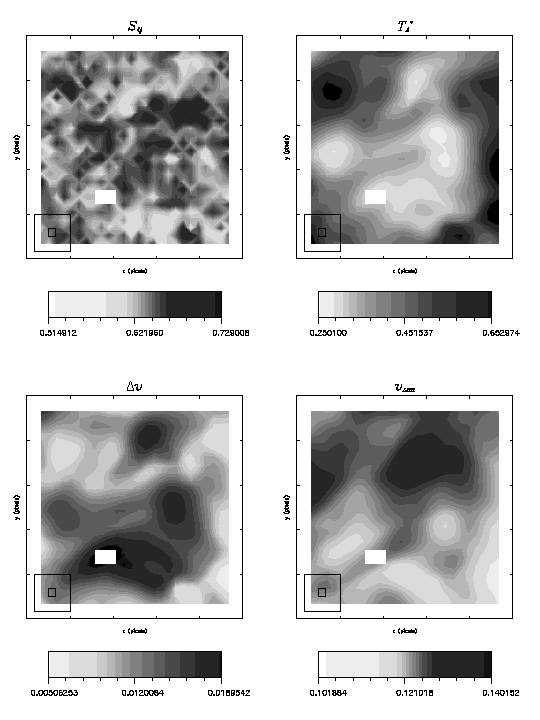
Click here for SCF maps of the Mac Low et al data cube.
For an explanation of the symbols used and the data in the results page click here.
Back to SCF Home Page