COLLISIONAL CASCADES IN PLANETARY DEBRIS DISKS
I. STELLAR FLYBYS
Scott Kenyon (SAO) & Benjamin Bromley
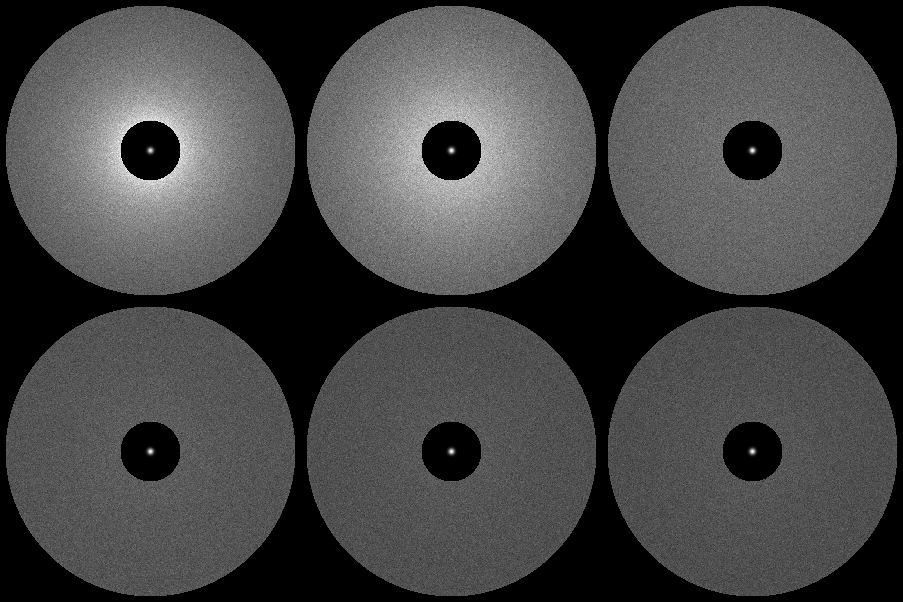
The animation below shows a 50 million yr (50 Myr) sequence of model images for the time evolution of a protoplanetary disk which extends from 30 AU at its inner edge to 150 AU at its outer edge. The calculation begins at t = 0 with 10 earth masses of solid material in orbit around a 3 solar mass star. The position of this star is shown as a bright point at the center of the disk. The 64 annuli in the model grid initially contain small planetesimals with radii of 10 cm to 10 m. The rapid passage of a star (not shown) perturbs the planetesimals into eccentric orbits ( e = 0.01) around the central star.

|
Credit for all images: S Kenyon (SAO) and B Bromley (Univ of Utah). The calculations were performed on the SGI Origin-2000 supercomputer known as `Alhena' at the Jet Propulsion Laboratory. |
At the start of the calculation, high velocity collisions between small planetesimals produce microscopic dust grains which absorb and re-radiate light from the central star. These dust grains produce the bright ring at the inner edge of the disk.
As the calculation proceeds, collisions damp particle velocities. Lower velocity collisions produce less dust. The brightness of the disk thus fades with time. The fading looks like a wave which propagates from the inner edge of the disk outwards. The disk dims a hundredfold over 50 Myr.
As the brightness of the disk fades, the planetesimals collide and merge to form larger and larger objects. After only 1 Myr (when the disk is just starting to fade), the largest objects are 40 m across; the objects grow to 100 m after 10 Myr (when the disk is uniformly dim), and are almost 20 km across at 50 Myr (when the disk is almost invisible).
As these objects continue to grow, they eventually reach sizes of 1000 km (the size of Pluto) or larger. Icy planet formation folliwing the stellar flyby produces another dusty phase which resembles images of debris disks .
| Click here to see a still from the calculation. |
| Click here to see a more complete description of the calculation. |
| Click here to read a paper describing the calculation. |
SAO Home | CfA Home | Astronomy Dept Home | Smithsonian Institution Home
