NEOCP Statistics
FIGURES BELOW ARE OUTDATED!!! MYSQL DB IS NO LONGER UPDATED FOR NEOCP TABLES!!!
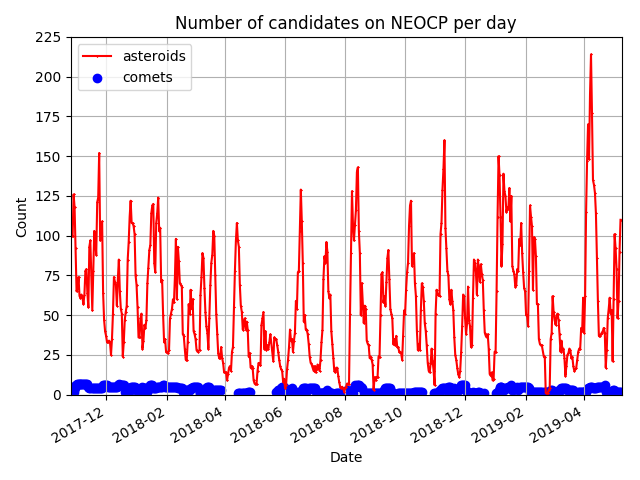
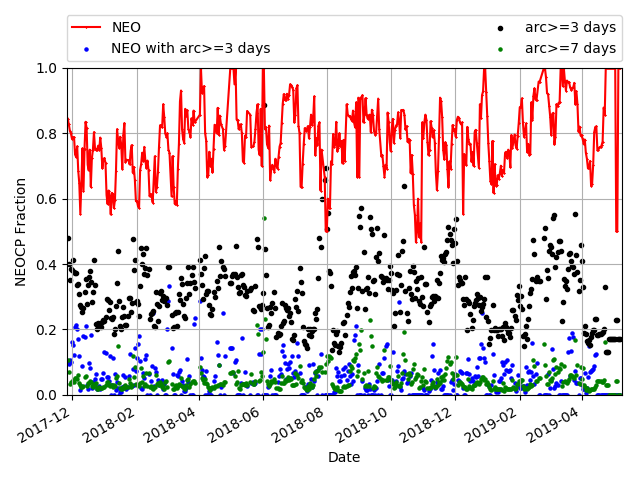
LEFT: Fraction of NEOs and NEOs with long arcs on NEOCP, RIGHT: Number of asteroid and comets candidates on NEOCP, as a function of date.
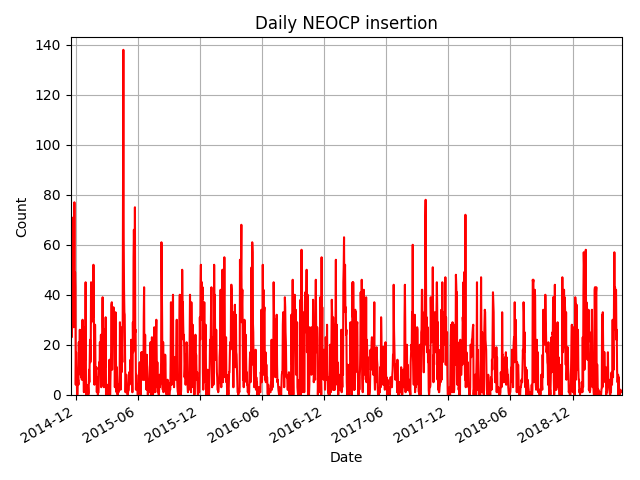
Number of NEOCP objects added per day since late 2014.
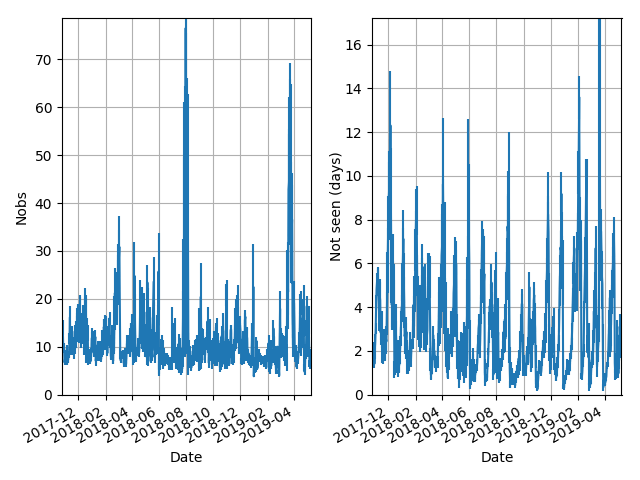
Mean number of detections (left) and not_seen parameter (right) on NEOCP as a function of date.
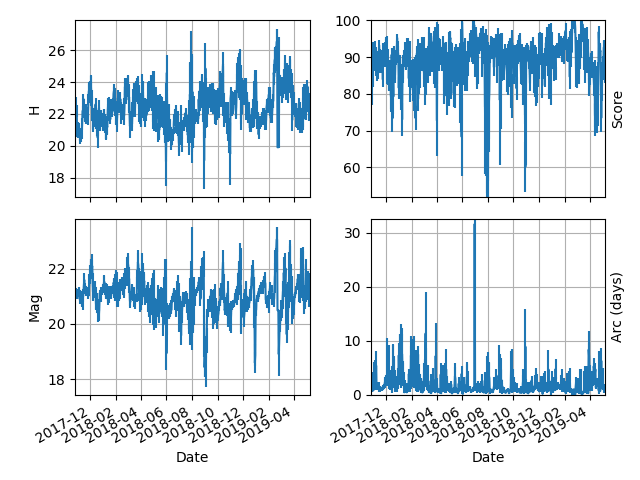
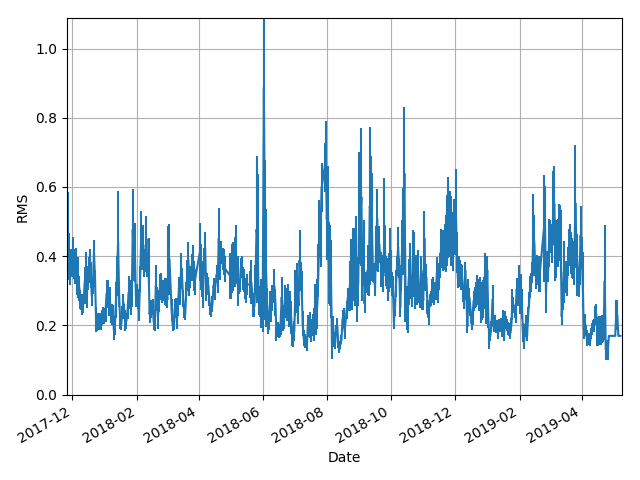
Daily statistics of NEOCP: mean absolute magnitude (H), NEO desirability score, V-band magnitude and arc length.
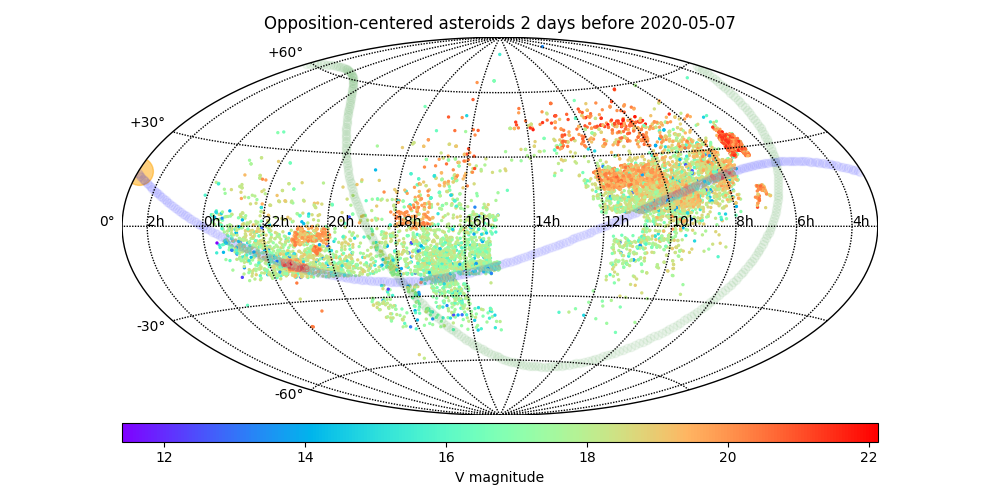
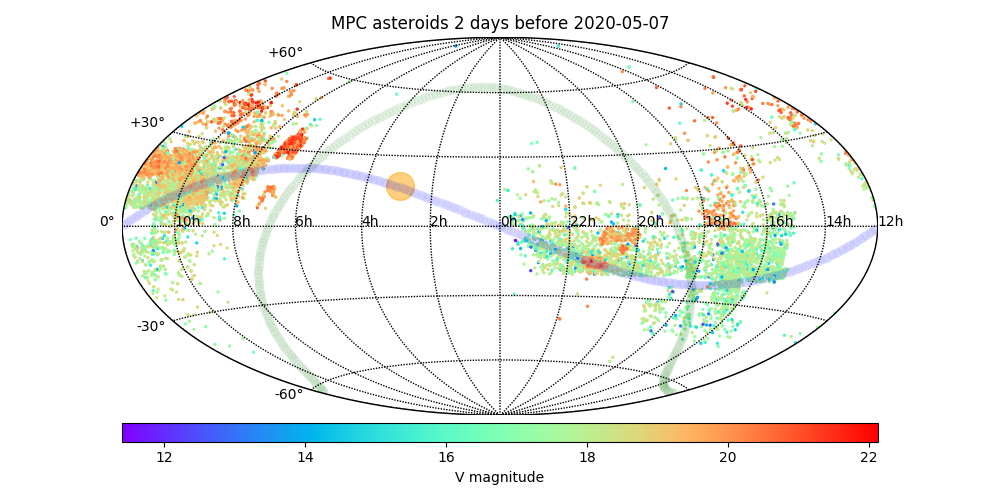
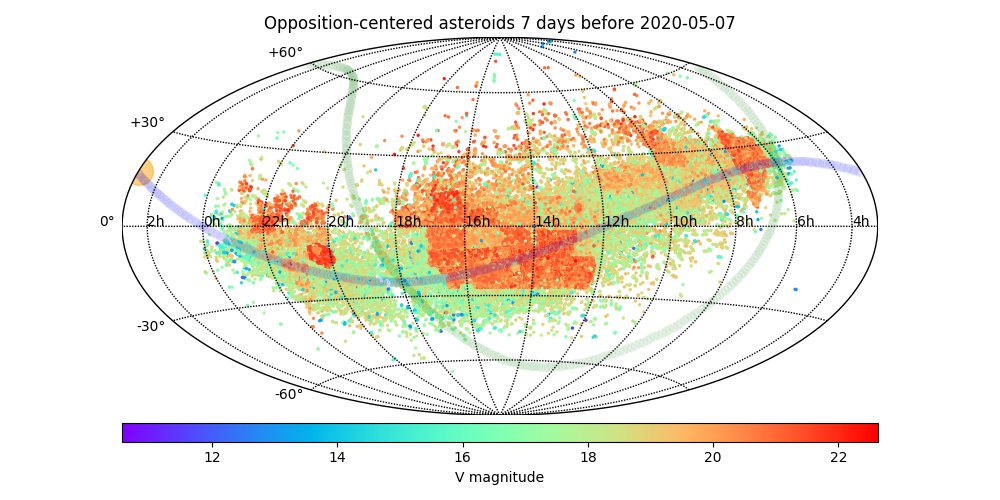
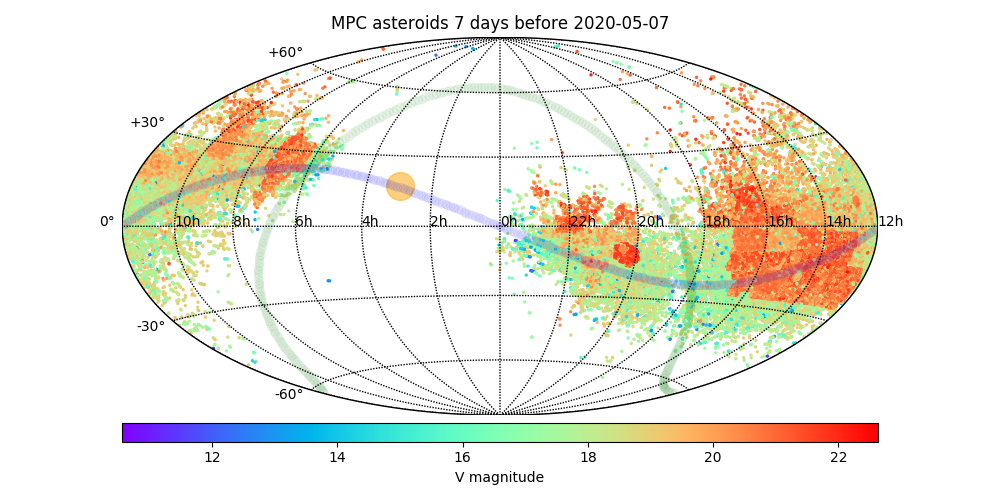
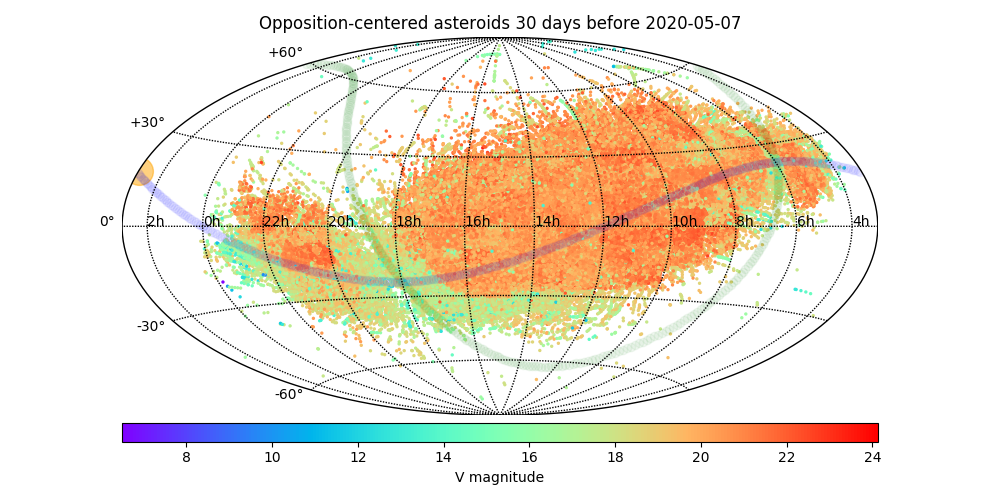
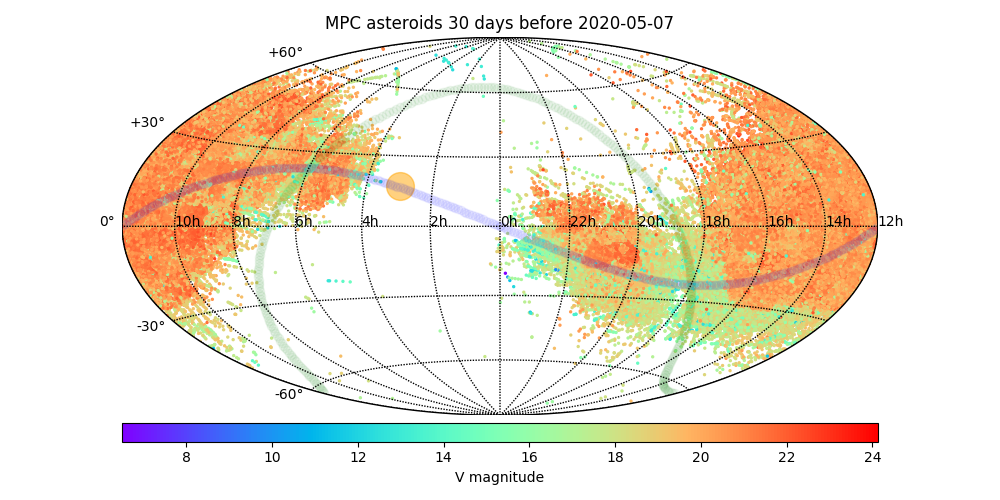
Opposition-centeted (left) and equatorial (right) right ascension and declination of asteroids observered within the last 2, 7 and 30 days. The location of the Sun corresponds to the current date. Plots show tracklets from "observations" and "ITF" data sources.
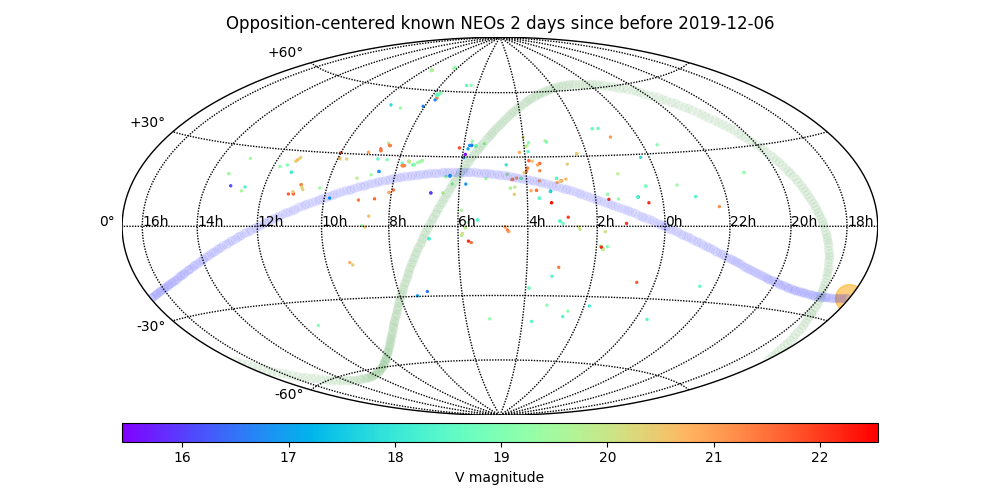
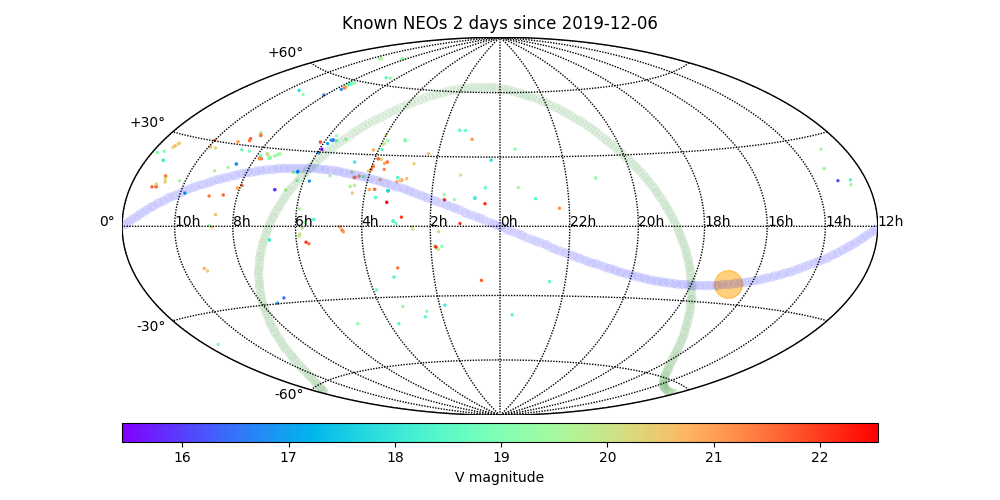
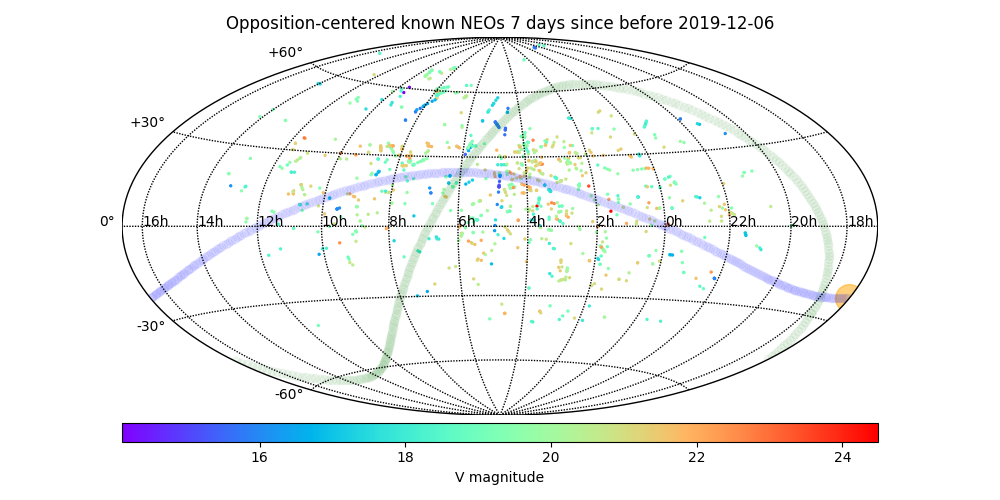
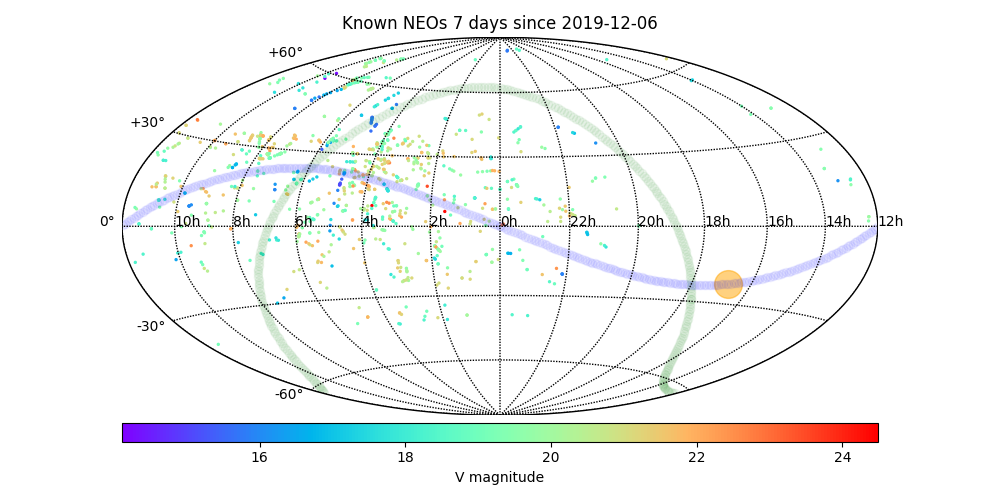
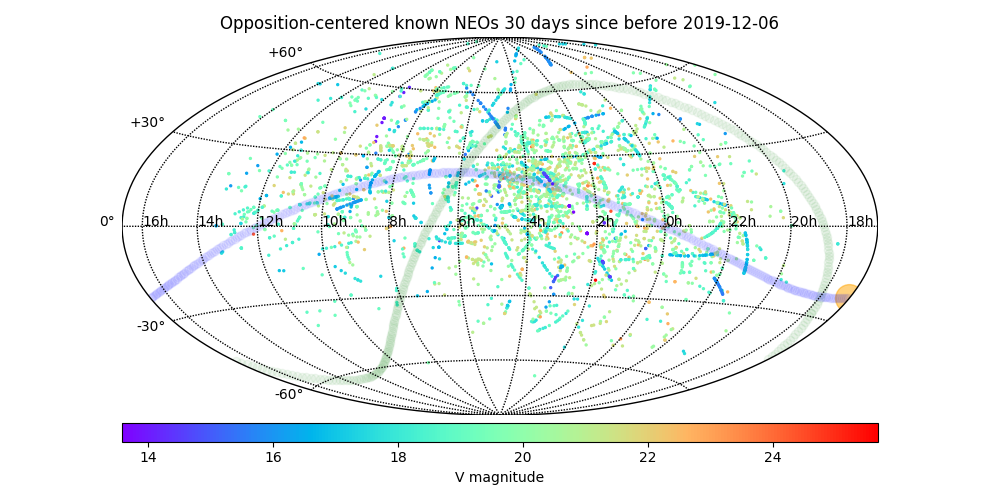
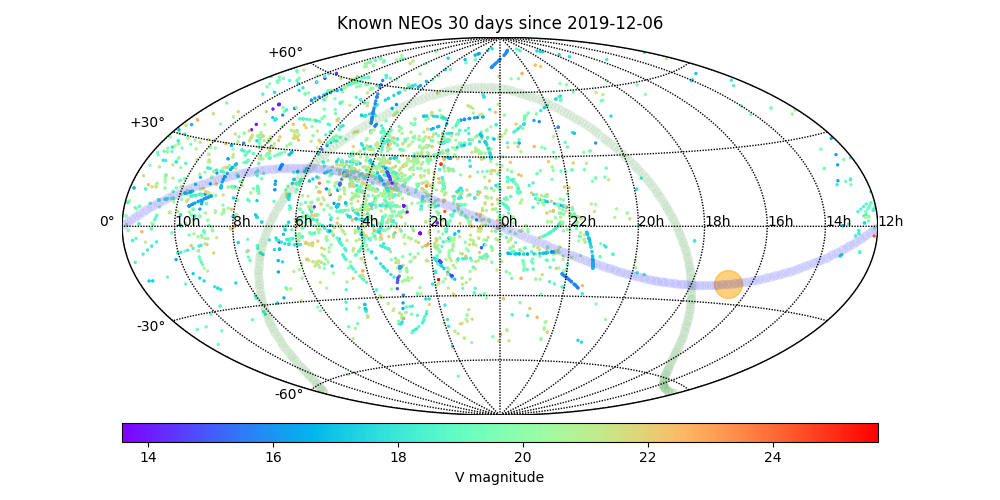
Opposition-centeted (left) and equatorial (right) right ascension and declination of NEOs observered within the last 2, 7 and 30 days. The location of the Sun corresponds to the current date. Plots show tracklets from "observations" data source.
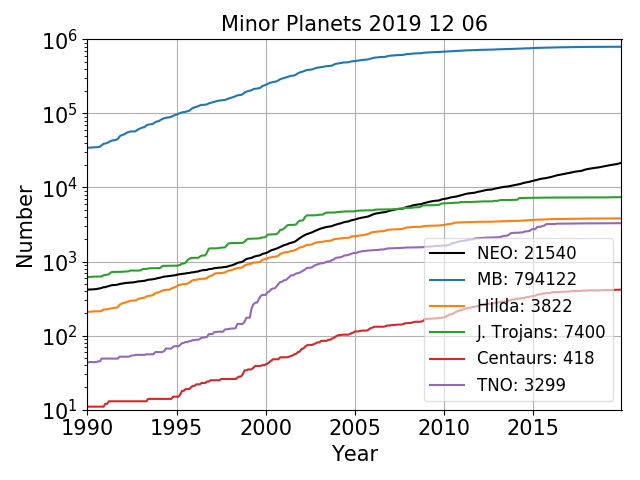
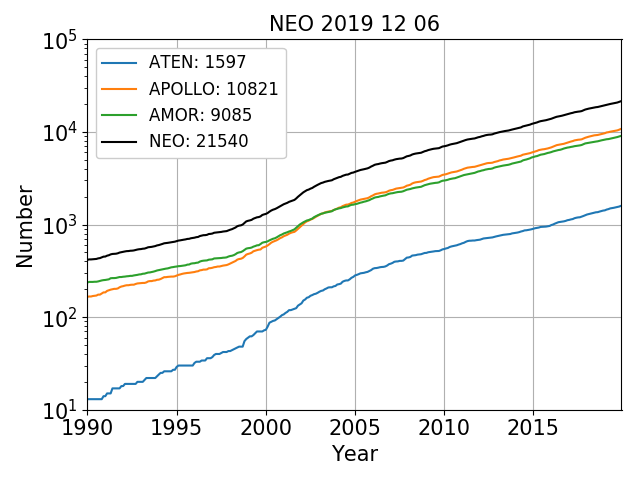
Cumulative plot of objects as a function of time of discovery. NEA (left) and all asteroids (right).
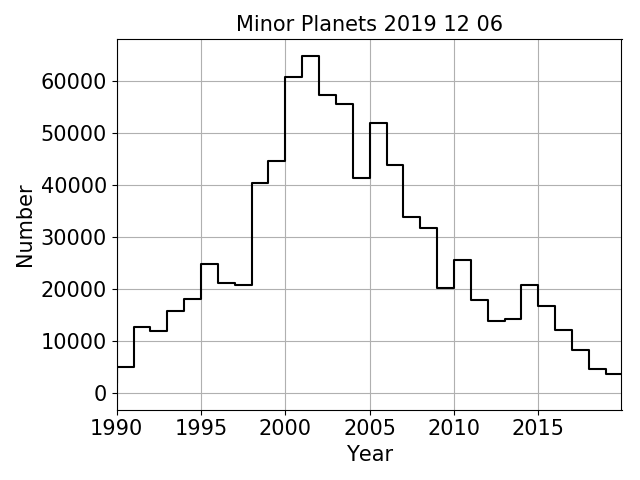
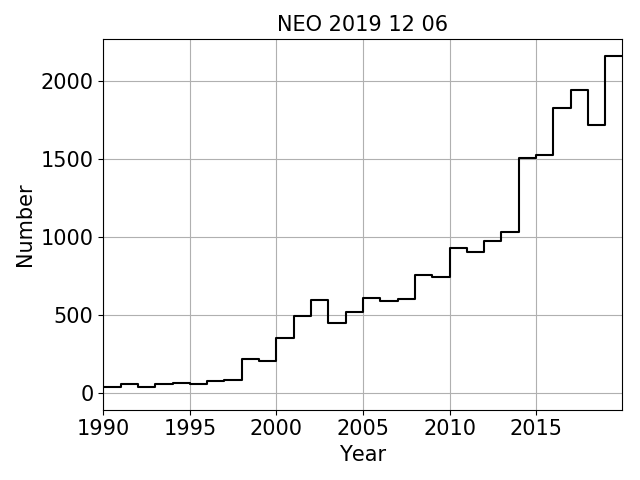
Histograms of objects as a function of time of discovery. NEA (left) and all asteroids (right).
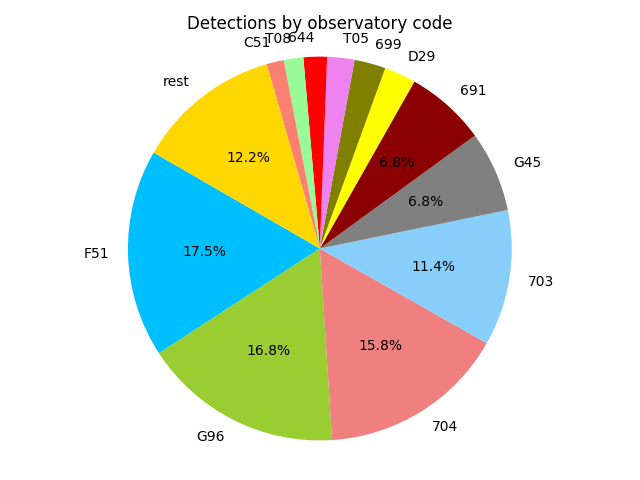
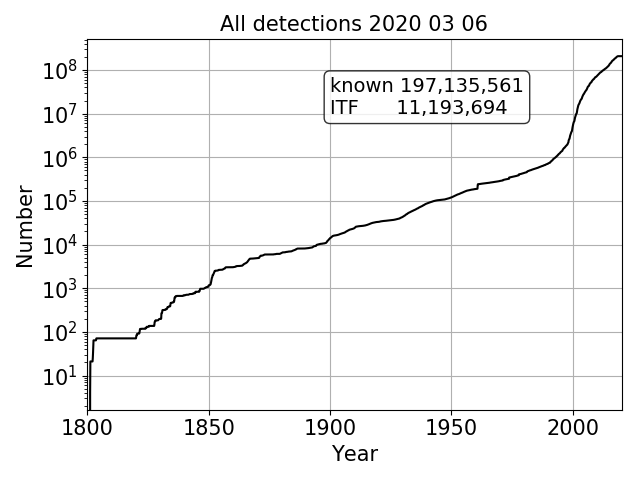
Number of all detections ever submitted to MPC (known and ITF) (left) and most prolific observatory sites by number of detections.
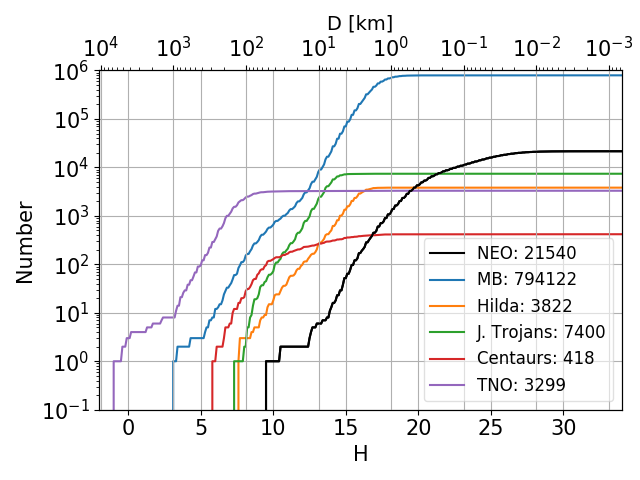
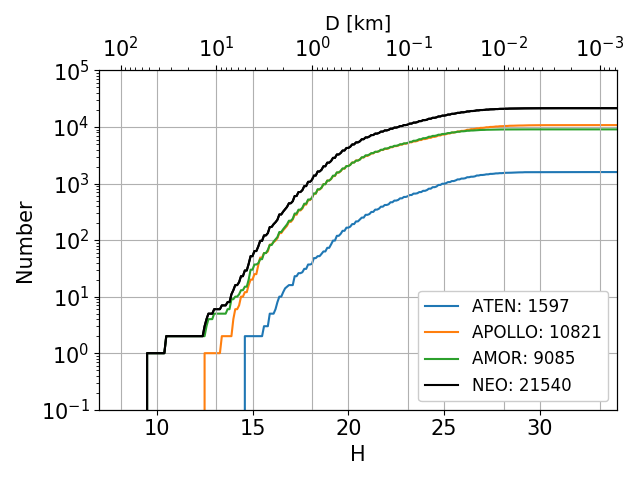
Cumulative plot of objects as a function of absolute magnitude. NEA (left) and all asteroids (right).
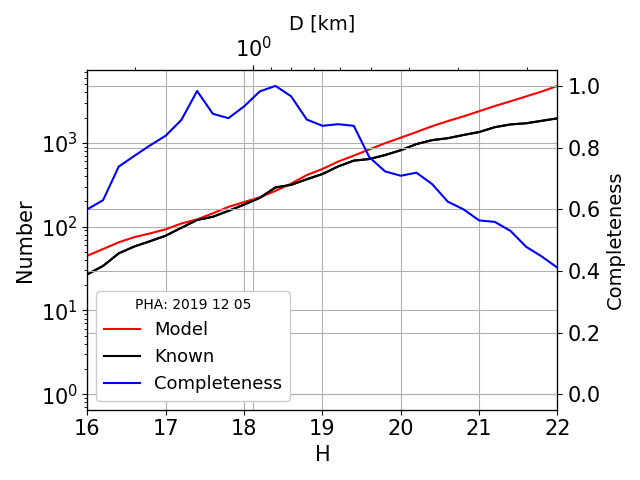
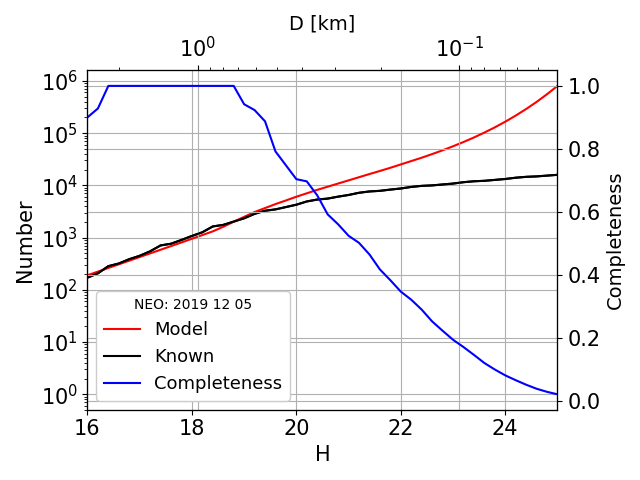
Cumulative plot of objects as a function of absolute magnitude versus the model population. NEA (left) and PHA (right). Population model was derived from Grav et al. (2011) for H<= 18.5 and Granvik et al. (2018), for H>18.5.
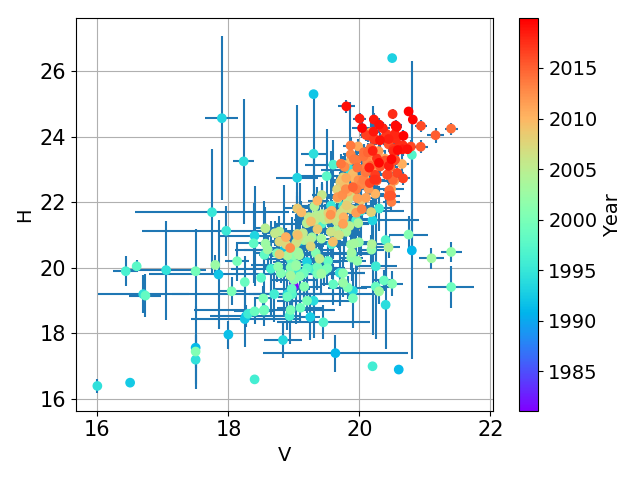
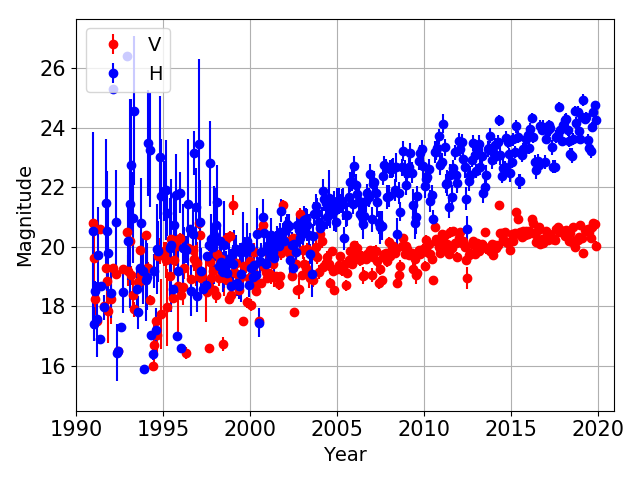
Mean absolute (H) and apparent (V) magnitude of NEA as a function of discovery epoch, in 30-day bins (left) and a scatter plot of mean apparent (V) and absolute (H) magnitude of NEA at a time of discovery (left). Error bars represent standard deviation of mean.