Occurrence of Ozone Anomalies over Cloudy Areas in TOMS Data
![]()
Liu, X., M.J. Newchurch, and J.H. Kim, Occurrence of ozone anomalies over cloudy areas in TOMS data, Atmos. Chem. and Phys., 3, 1113-1129, 2003. [Full text (pdf)]
1. Introduction
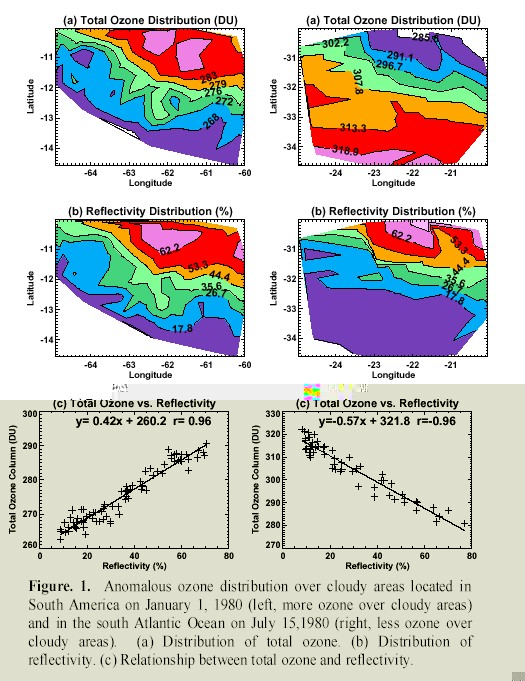
We have found anomalous ozone distribution over cloudy areas compared to the total ozone in neighboring clear areas. Figure 1 presents two examples of such anomalous ozone distribution, where there is more ozone (left) or less ozone (right) over cloudy areas. In both cases, the total ozone is high spatially correlated with the cloud reflectivity field. Such anomalous ozone distribution over cloudy areas must be due to either ozone retrieval errors associated with clouds or the actual geophysical phenomena (dynamical or chemical effects). Motivated by understanding the mechanisms of formation of ozone anomalies, we investigated the frequency of anomalous ozone distribution (ozone anomalies) over cloudy areas in TOMS Version-7 Level-2 data and analyzed their formations.
2. Ozone Anomaly Distribution
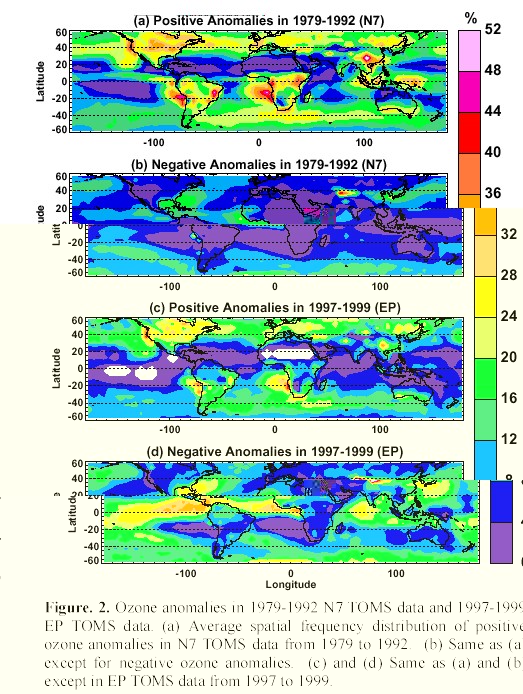
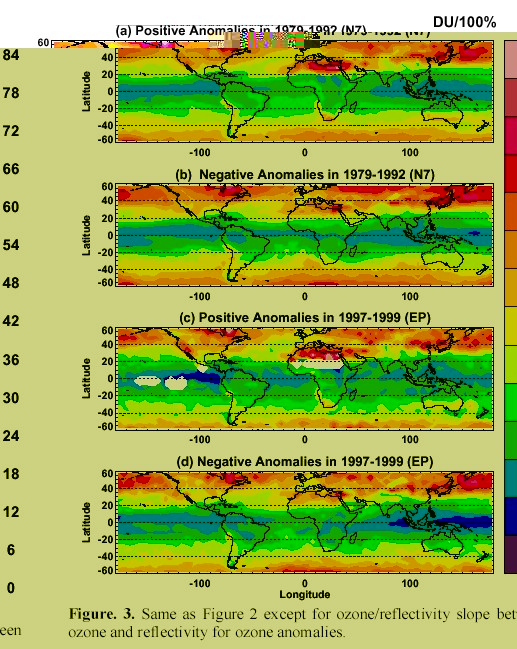
We define an ozone anomaly as a spatial ozone distribution in 5 degree longitude by 5 degree latitude if the correlation coefficient between ozone and reflectivity is >= 0.5 (positive ozone anomaly) or <= -0.5 (negative ozone anomaly). We also require there are at least 20 measurements and the reflectivity range greater than 30% to obtain statistically significant ozone anomalies. Figure 2 shows the average spatial frequency distribution of positive and negative ozone anomalies in 1979-1992 Nimbus-7(N7) TOMS data and 1997-1999 Earth-Probe (EP) TOMS Data. A high frequency of ozone anomalies, with a global average frequency of ~ 23% is observed to occur over cloudy areas in both N7 and EP TOMS data. Ozone anomalies are not evenly distributed globally and some regions are dominated with a high density of positive or negative anomalies. There is an obvious N7/EP contrast in frequency of positive and negative anomalies. The frequencies of positive and negative anomalies are 15.6% and 7.2% in N7, but 10.5% and 12.5 in EP. The higher frequency of positive anomaly in N7 results from the non-linear calibration difference between N7 and EP TOMS causing a larger cloudy/clear total ozone difference in N7. In spite of these differences, the spatial distributions of ozone anomalies are very similar. Figure 3 shows the average linear regression slope between ozone and reflectivity for positive and negative ozone anomalies in TOMS data. The ozone/reflectivity slope is mainly a function of latitude and increases from 12-30 DU/100% in tropical areas to 36-84 DU/100% in mid-latitudes. The spatial frequency distribution of ozone anomalies and ozone-reflectivity slope distributions are consistent from year to year in N7 and EP, respectively.
3. Mechanisms of Ozone Anomaly Formation
3.1. Cloud-height errors
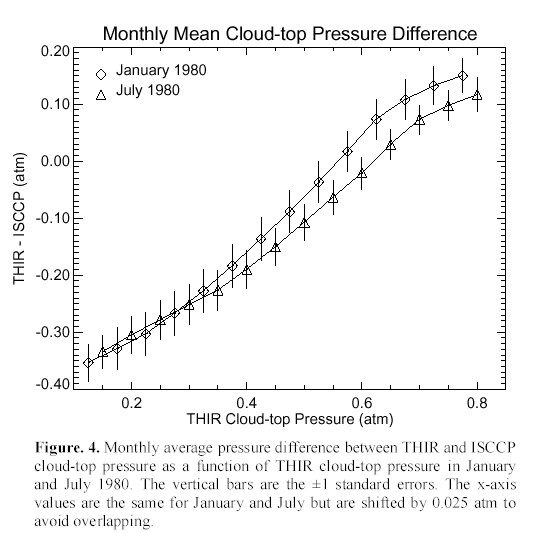
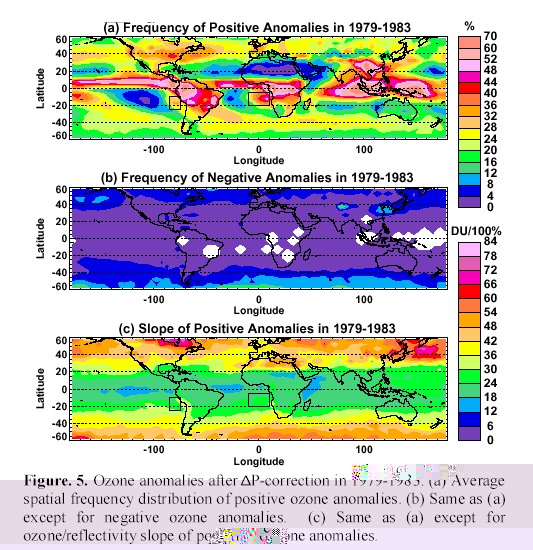
Large cloud-height errors are observed in the V7 TOMS algorithm in comparison with spatially and temporally co-located Thermal Humidity Infrared Radiometer (THIR) cloud-top pressures on board N7 Figure 4. The assumed cloud-top pressure is usually overestimated by 200-300 mb for high clouds, and underestimated by about 100 mb for low clouds. Correcting the cloud-height errors (called the D P correction) significantly changes the ozone/reflectivity slope, usually increasing by 10-15 DU/100% or decreasing by 3-5 DU/100% for ozone anomalies in both tropical and mid-latitude regions. Figure 5 shows the average ozone anomalies distribution after correcting cloud-height errors in 1979-1983 TOMS data where THIR data is available. We can see that most of the negative anomalies are eliminated and the frequency of positive anomalies is largely increased, especially in the tropical convective cloudy areas. This correction of most negative anomalies indicates that negative anomalies are mainly caused by underestimates of cloud-top heights.
3.2. Tropical high-reflectivity convective clouds
Peaks in the frequency of positive anomalies in the tropical convective cloudy areas follow the motions of ITCZ regions, but the average slope shows little variation with a magnitude of ~22 DU/100%. The excess ozone over cloudy areas is not due to dynamical and chemical effects, but is due mainly to ozone retrieval errors including incorrect tropospheric climatology, some non-linearity calibration errors, and probably the treatment of optical thick clouds as Lambertian clouds in the TOMS V7 algorithm. [See more details about ozone retrieval errors in TOMS accuracy description]
3.3. Planetary-scale and Synoptic-scale wave activities
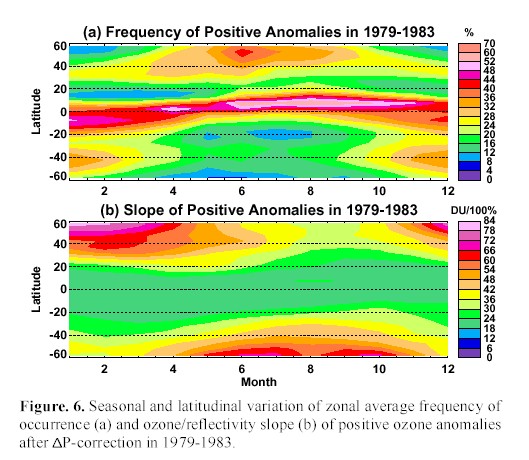
For ozone anomalies in mid-latitude regions, the positive errors associated with clouds only can account for the much larger magnitude of ozone/reflectivity slope. Other factors must be responsible for the larger slopes. Figure 6 shows the seasonal variation of zonal average frequency and slope of positive ozone anomalies in 1979-1983 TOMS data after correcting cloud-height errors. The slope of positive anomalies in mid-latitude regions peaks from late fall to early spring (60-80 DU/100%), and is lowest in the summer (30-40 DU/100%). The large slope and typical seasonal variation indicate that they are mainly due to planetary-scale wave and synoptic wave disturbances. These dynamic phenomena can greatly affect both total ozone fluctuations and cloud patterns (high ozone is usually associated with cyclones, i.e. over clouds), leading to the formation of mostly positive anomalies and fewer negative anomalies.
3.4. Low marine stratus clouds and enhanced tropospheric ozone
High frequency of positive ozone anomalies is observed to occur in regions of marine stratocumulus cloudy regions off the west coast of South Africa and South America (in Figure 2 and Figure 5). The slope of positive anomalies in oceanic regions off the west coast of South America and South Africa shows a maximum from August to October (i.e., the biomass burning season) and a minimum from Feburary to April. The cloud height used in the TOMS V7 algorithm, about 750 to 900 mb, is consistent with the THIR cloud height. The causes of these ozone anomalies are mainly the combination of low marine stratus or stratocumulus clouds and the enhanced tropospheric ozone above these clouds. The high-reflectivity surface increases the retrieval efficiency of enhanced lower tropospheric ozone even to be greater than 1, forming positive ozone anomalies. When the cloud height is high enough, negative anomalies would be formed because of underestimates of the enhanced tropospheric ozone below clouds.
4. Implications of Ozone Anomalies
Analysis of ozone anomalies indicates that some ozone anomalies are due to ozone retrieval errors and some are caused by actual geophysical phenomena such as planetary and synoptic wave activities. Inclusion of the cloudy total ozone that contains ozone retrieval errors will propagate to affect the corresponding results in particular applications such as calculations of monthly mean ozone climatology, analysis of the ozone seasonal variation, evaluation of ozone trends, and tropospheric ozone derivation.
Analysis of the effects of clouds on these applications is very complicated, because the overall effect of different types of errors depends on factors such as cloud altitude, cloud-height errors, and cloud fraction, and these factors might have seasonal variations. In the current TOMS V7 L2 data, the negative cloud-height errors and other positive errors usually partly cancel, leading to an overall smaller error. In applications related to global mean or zonal mean, the overall error is expected to be small. For studies of a particular region during a special period, however, special care should be taken regarding the effects of clouds in those regions with high frequencies of positive or negative anomalies.
Ozone anomalies have important implication for applications using the clear/cloudy ozone differences such as the CCD method. In mid-latitudes, the large cloudy and clear total ozone difference due to planetary and synoptic wave disturbances makes it risky to apply the CCD method. In tropical areas, if accurate cloud height information is available, the positive errors above clouds tend to underestimate the derived tropospheric ozone. However, some special samplings in the CCD method tend to cancel or partly cancel the underestimated ozone.
Some N7/EP non-linearity calibration differences remain. However, the correct partitioning of this error between N7 and EP is not clear. Inclusion of both EP and N7 TOMS data for a trend analysis might lead to incorrect conclusions.
Knowledge of these different types of errors is important for studies using the TOMS measurements, because these errors might significantly affect particular applications. Furthermore, correcting only one of these errors could lead to even larger overall errors. In future instruments such as the Ozone Monitoring Instrument (OMI) that can accurately determine the cloud height from visible and infrared channels, the cloud-height-related errors can be avoided.