|
MMIRS Observing |
|
|
| Field-of-view: | 6.9 x 6.9 arcmin | |
| Pixel scale: | 0.2012 arcsec/pix (optical layout) | |
| Detector: | 2048 x 2048 pix, HgCdTe Hawaii-2RG | |
| Electronics gain: | 1 e-/DN (for spectroscopy); 2.5e-/DN (for imaging) | |
| Read-noise (per read): | 11 e- (with gain=1) | |
| Full well: | TBD | |
| Linearity: | Linearity correction TBD | |
| Dark current: | < 0.01 e-/s/pix expected at 78K set point. | |
| Readout: | 32 channels; 1.4 sec for a single read. | |
| Data Acquisition: | The HAWAII2-RG is a CMOS device that reads non-destructively. There is no shutter. Images are obtained by differencing a pair of reads N seconds apart ("double-correlated sampling"), or, preferably, by taking multiple reads and then fitting a linear slope to each pixel ("up-the-ramp sampling"). Up-the-ramp sampling can measure count rates for pixels that saturate or have cosmic rays hits during an exposure (using mmfixen). | |
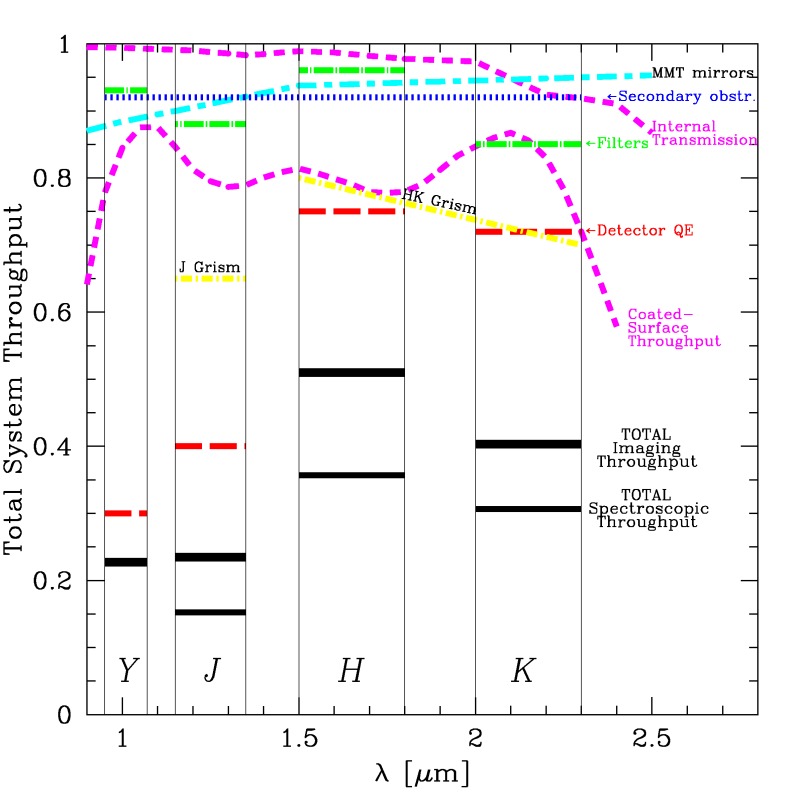
A table of the MMIRS optics transmission and detector QE is here. The overall throughput in this table may be slightly optimistic but the shape of the curve across each bandpass should be close.
Atmospheric transmission models for Gemini on Cerro Pachon (similar altitude) can be found here
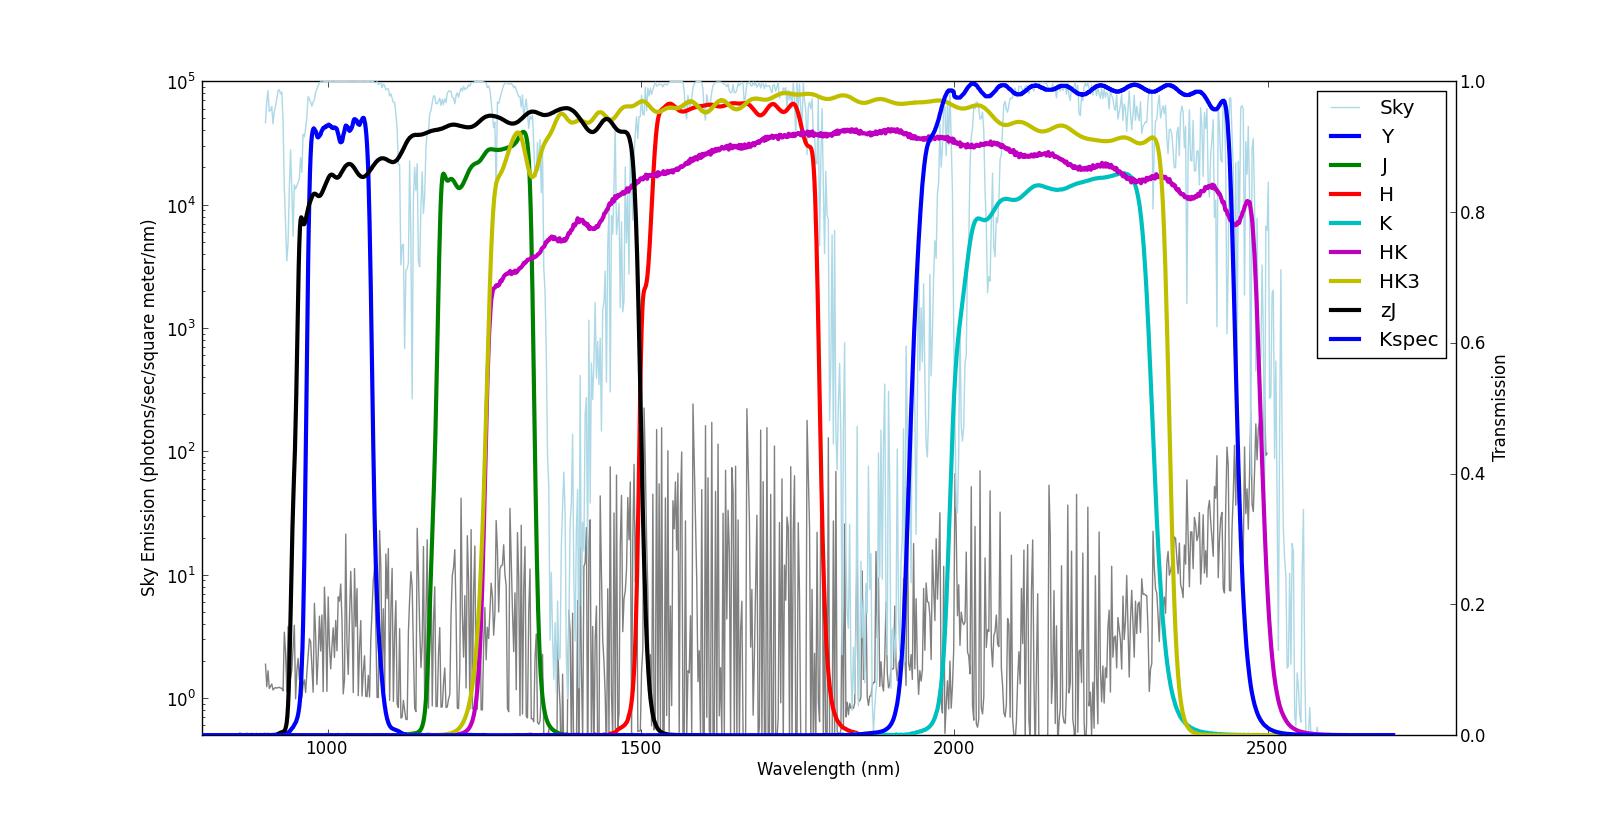
| Filter Transmission Data | |||
| Filter | Cuton | Cutoff | Comments |
| Y | 0.97 | 1.07 | |
| J | 1.17 | 1.33 | |
| H | 1.50 | 1.78 | |
| K | 2.00 | 2.32 | K-short filter, primarily for imaging |
| HK | 1.25 | 2.49 | HK spectroscopic filter available 2010-. The red extent of this filter causes some loss of sensitivity in the H-band due to scattered thermal emission. Also order overlap in the wings of the bandpass causes contamination of the reddest end of the spectrum. |
| HK3 | 1.25 | 2.34 | New HK filter available 2014-. Has shorter red end cutoff to minimize scattered light. This filter also has very high throughput, so if you don't need to go beyond 2.34 microns, it is a better choice than HK. |
| zJ | 0.95 | 1.50 | Spectroscopic filter |
| Kspec | 1.93 | 2.45 | New K spectroscopy filter available 2014B-. |
| HKold | 1.26 | 2.25 | Old HK filter used prior to August 2010. No longer available |
Imaging: Exposure Time Calculator
| Exposure times: | Minimum exposure time is 1.4s |
| Focus: | Instrument focus is stable and is not changed. Telescope focus is provided by the wavefront sensor. |
| Sky background: | Dominated by narrow OH emission lines and broad H2O absorption bands (additional discussion). |
| Overhead: | 14 sec total overhead per exposure, including 30 arcsec telescope dither. |
| Guiding: | Images are unguided. |
| Strategy: | Long integrations are made from a series of short exposures, otherwise the night sky quickly saturates the detector (see Imaging Senstivity table). Images are typically obtained in a dither sequence. Sky background is measured, and removed, by median-combining a set of dithered images. This works well for sparse fields and point sources, however observations of extended objects require dithering on an OFF field to measure the sky background. Worked example. |
| Imaging Sensitivity | ||||||
| Magnitude of Point Source
(Vega mag) with S/N=10. | ||||||
| Time [sec] | Y | J | H | K | ||
| 60 | 20.3 | 20.1 | 19.5 | 18.8 | ||
| 300 | 21.2 | 21.0 | 20.4 | 19.7 | ||
| 3600 | 22.5 | 22.4 | 21.7 | 21.0 | ||
| Exposure time for sky background to reach half of saturation [sec] | 500 | 300 | 40 | 55 | ||
| Total System Throughput | 0.23 | 0.24 | 0.51 | 0.40 | ||
| Slit mask field: | 4 x 6.9 arcmin |
| Slitlets: | Recommend >=0.4" wide slits at least 7" long. The optimal slit width depends on the seeing which is not possible to predict in advance. The quoted resolutions are for a width of 0.4" (2 pixels). Wider slits allow higher throughput, but also higher background, and fewer pixels uncontaminated by OH lines. Slit widths of 0.5" have been used to good effect on previous programs. |
| Long Slits: | 0.2, 0.4, 0.6, 0.8, 1.0, 1.2, 2.4 x 420 arcsec |
| Wavelength coverage: | Provided by filters; grisms cannot be tilted. |
| Cal lamps: | Continuum, Argon |
| Telluric calibration: | Bright A0 stars |
| Observing Strategy: | Similar strategy as imaging, except that the target(s) must be dithered along the slit(lets). Exposure times can be much longer because the sky background is dispersed. In addition, argon lamp exposures are required at each pointing to perform wavelegth calibration, and a bright telluric standard should be observed at identical airmass. |
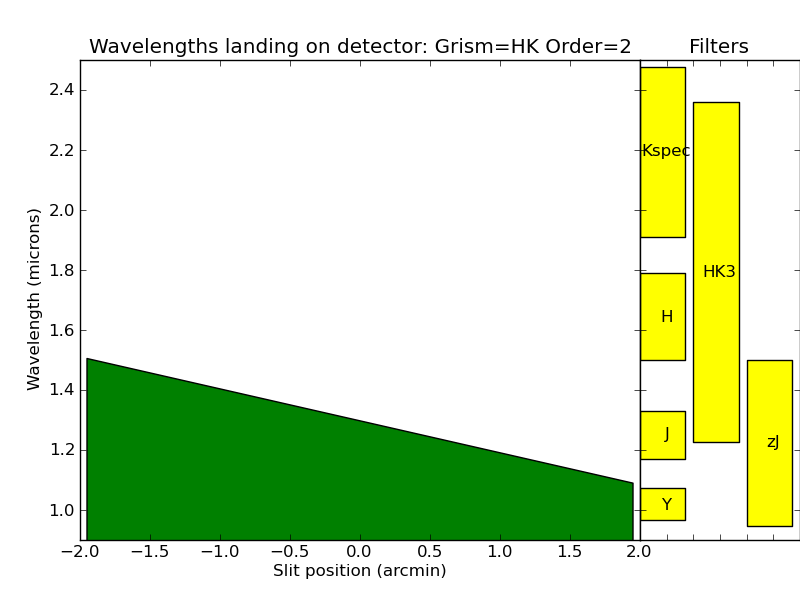
| Grism Modes | |||||||||
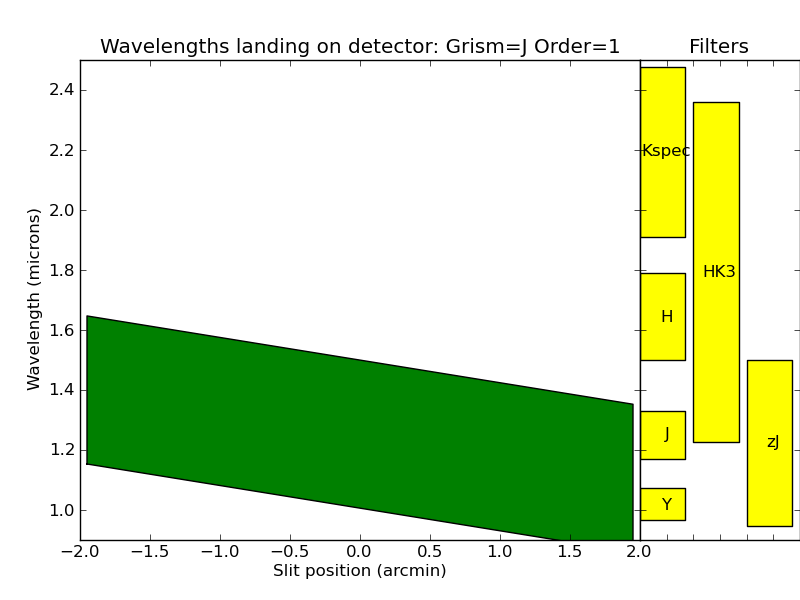
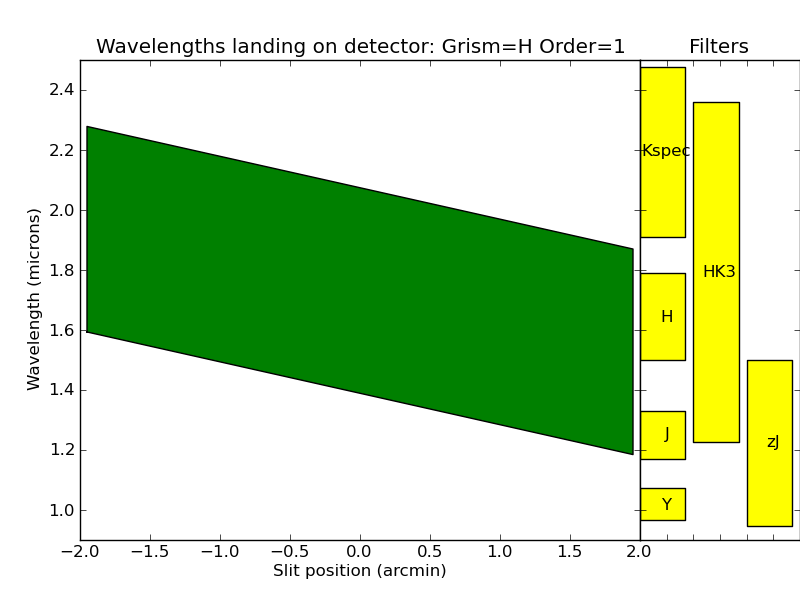
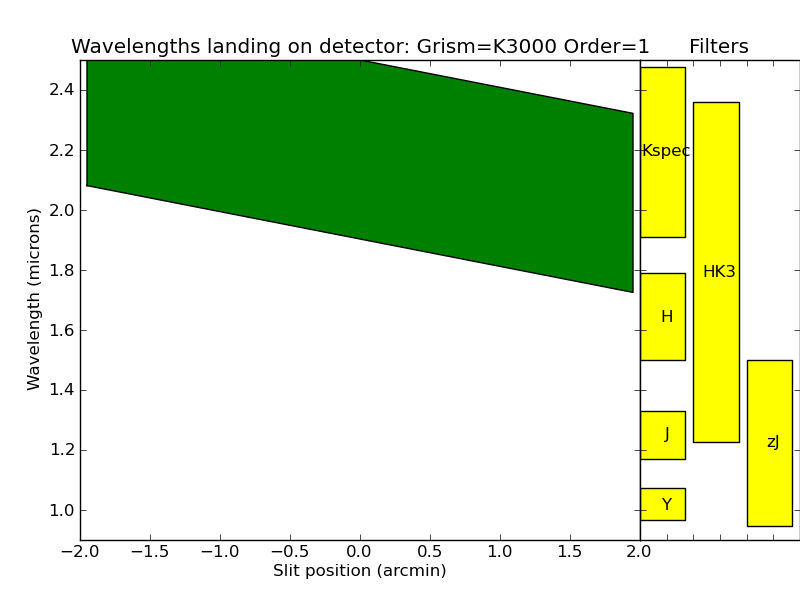
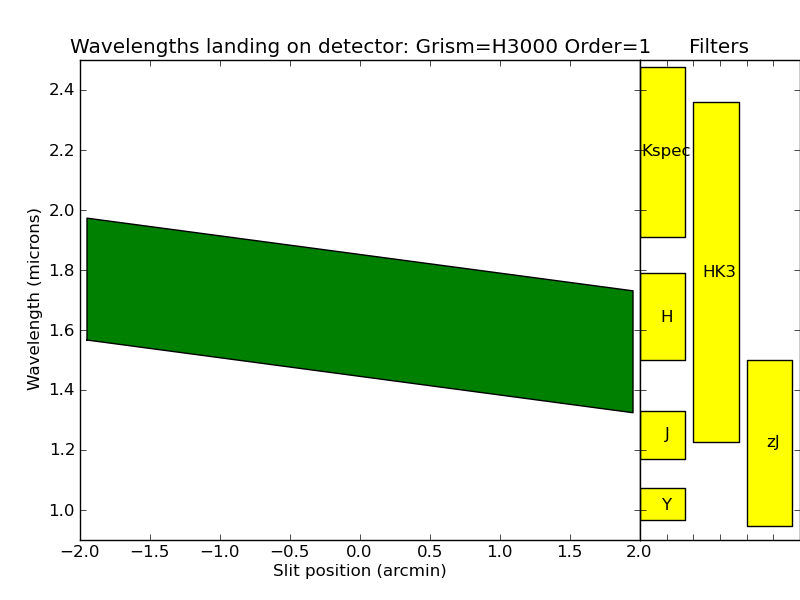
| Grism | Order | Filter | Wavelength range (um) | Spectrum dispersed over (pix) | Resolution (0.4'' slit) | Field for complete spectra (arcmin)* | Grism Efficiency over band | S/N plots for an A0 star | Notes |
| HK | 1 | HK | 1.25-2.45 | 1800 | 1400 | -0.5 to +0.5 (plot) | 70% | plots | Though offering both H and K simultaneously, the significantly lower throughput at K, and the lower resolution at H both compromise signal to noise. S/N in H-band for faint sources is dominated by the presence of OH lines. The higher the resolution, the larger the fraction of the spectrum that is uncontaminated by OH. Consider the H3000 and K3000 grisms instead. |
| HK | 1 | K | 1.98-2.32 | 550 | 1700 | -2.0 to +1.2 (plot) | 70% | plots | |
| HK | 1 | H | 1.50-1.79 | 450 | 1300 | -1.7 to +2.0 (plot) | 80% | plots | |
| HK | 2 | Y | 0.96-1.07 | 360 | 1600 | -2.0 to +2.0 (plot) | 60% | plots | |
| HK | 1+2 | zJ | 0.95-1.5 | var | 800,1600 | n/a (plot1, plot2) | var | plots | |
| J | 1 | J | 1.17-1.33 | 720 | 2800 | -2.0 to +2.0 (plot) | 65% | plots | |
| J | 1 | Y | 0.96-1.07 | 520 | 2400 | -0.5 to +2.0 (plot) | 33% | - | |
| J | 1 | zJ | 0.94-1.51 | 2600 | 2400 | n/a (plot) | 50% | plots | |
| H | 1 | H | 1.50-1.79 | 800 | 2400 | -1.0 to +2.0 (plot) | 75% | plots | |
| H | 2 | Y | 0.96-1.07 | 670 | 3000 | -2.0 to -0.3 | 40% | plots | |
| K3000 (VPH) | 1 | Kspec | 1.95-2.45 | 1000 | 3000 | -0.5 to +0.5 (plot) | - | - | This grism gives significantly higher throughput over the full K-band than does the HK grism. |
| H3000 (VPH) | 1 | H | 1.50-1.79 | 1000 | 3000 | -1.0 to +1.0(plot) | 80% | - | This grism gives slightly higher throughput and higher resolution than the original H grism |