SCF Analysis for Heiles Cloud 2
This data cube was provided by Mark Heyer and Ned Ladd of FCRAO. The results have yet to be published and we are thus very grateful for these data. At detailed analysis will be presented in deVries, Ladd, Heyer & Snell (in preparation).
Click for eps format of plot
| Heiles Cloud 2 | Real Data | Randomized Data | ||||||
| Parameter | Mean | Std. Deviation | Skewness | Kurtosis | Mean | Std. Deviation | Skewness | Kurtosis |
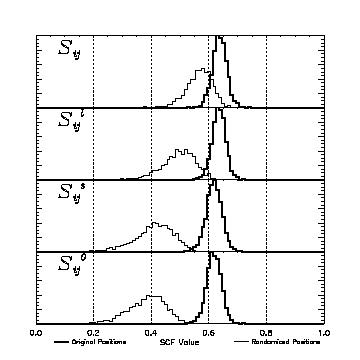
| S | 0.642 | 0.0299 | -3.01 | 38.8 | 0.569 | 0.0512 | -1.2 | 3.5 |
| Sl | 0.639 | 0.0328 | -6.59 | 108 | 0.498 | 0.0607 | -0.876 | 2.13 |
| Ss | 0.622 | 0.036 | -5.32 | 81 | 0.411 | 0.0742 | -0.949 | 1.54 |
| S0 | 0.622 | 0.0357 | -6.72 | 108 | 0.387 | 0.0683 | -0.865 | 2.19 |
| l | 0.000144 | 0.0254 | 0.154 | 1.93 | -0.00414 | 0.219 | 0.0806 | -0.404 |
| ll | 0.0000413 | 0.0254 | 0.14 | 1.91 | -0.00561 | 0.218 | 0.0708 | -0.414 |
Because the observational data have yet to be published, maps of the SCF and appropriate line parameters are not available.
For an explanation of the symbols used and the data in the results page click here.
Back to SCF Home Page