Primary cosmic microwave background anisotropy at arcminute scales
At angular scales near 0.5o, standard cosmological models predict
relatively large anisotropy caused by an acoustic "bounce" that occurred before
recombination.
The spatial frequency at which this peak occurs
depends on the fundamental cosmological parameter, W.
Additional smaller peaks are expected at multiples of the
peak spatial frequency.
Present CMBR observations show a clear maximum in the anisotropy spectrum
at a spatial scale somewhere near 1o, but the spectrum lacks detail
and the harmonic peaks at smaller scales have not yet been seen.
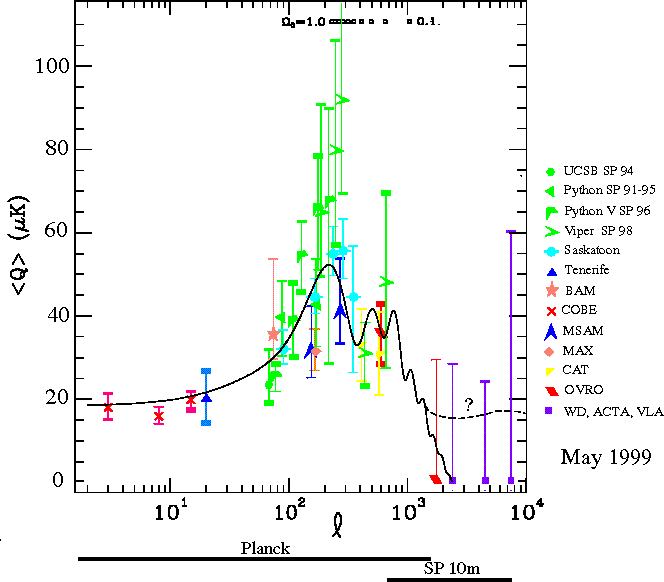
Cosmic Microwave Backround Angular Power Spectrum (after a figure by
M. White).
The experimental state of CMB anisotropy measurements as of May 1999.
Data from the highly successful Boomerang flight of December 1998 were not yet available.
Detected power is plotted as a function of angular scale (expressed
as spherical harmonic number).
The error bars are a combination of measurement noise and
sampling error that results from limited sky coverage.
The UCSB, Python, and
Viper observations were made from the South Pole.
The Viper results
shown here represent 10% of all Viper data collected to
date.
Other experiments shown are Saskatoon,
Tenerife,
BAM,
COBE,
MASM,
MAX,
CAT,
OVRO, and
VLA.
Note that the millimeter-wave single-dish results from the South Pole are
competitive with centimeter-wave single-dish, interferometers, and
balloon-borne single-dish experiments.
The power spectrum for
a standard cold dark matter (sCDM)
model (H0= 100 km s-1 Mpc-1, WB =
0.05, W = 1, L
= 0) is overlaid as a solid line.
The small square boxes near the top of the figure indicate the location
of the acoustic peak for values of W
between 0.1 and 1.
The peak at l = 200 corresponds to 0.5o on the sky.
The dotted line and question mark indicate that
the shape of the acoustic peak beyond l > 1000 is
sensitive to the conditions of the first recombination and possible subsequent
re-ionization. These processes are poorly understood.
The horizontal bars at the bottom show the range of spatial
scales at which the Planck satellite and the SPST are sensitive to
primary anisotropy.
The SPST will study the damping tail region at arcminute scales,
providing a test
of the acoustic oscillation model and providing measurements of peak positions
that will augment the lower spatial frequency information obtained with
meter-class telescopes.
The shape of the damping tail is a manifestation of the speed at which the
recombination process occurs, and the degree to which recombination is
mixed with re-ionization.
To study primary anisotropy at arcminute angular scales, it will be important
to simultaneously understand the secondary contribution to anisotropy due to
Sunyaev-Zel'dovich (S-Z) distortion in galaxy clusters between the
recombination last scattering
surface and the observer. Because of the low sky noise available at the Pole,
the SPST can be used over a wide range of frequencies, including the
200-300 GHz range of frequencies required to allow spectral separation of
thermal S-Z effect from primary anisotropy.
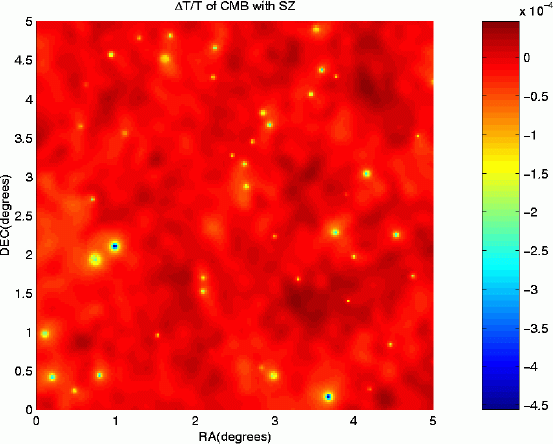
Simulated Fine Angular Scale CMBR Image (by J.
Peterson). Simulated CMB structure on a twenty-five square degree region of sky. The faint
extended structure is primary CMB anisotropy, while the strong localized sources are
secondary anisotropy due to the Sunyeav-Zel'dovich effect in galaxy clusters. In
this model, S-Z signal dominates at fine angular scales. The simulation does not include
the S-Z filaments expected from the collapse of 100 Mpc structures.
Scaling the results of Python and Viper, the SPST will achieve 10 µK or better temperature sensitivity per pixel at
spatial scales between 103 < l < 104.
Among all telescopes that could be used for CMB measurements at
spatial scales in this range, the SPST is likely to be the most sensitive
single-dish:
it will not be possible to fly 10m apertures in
balloons, airplanes, or spacecraft in the near future and the millimeter- and submillimeter-wave
sky noise at South Pole is excellent.
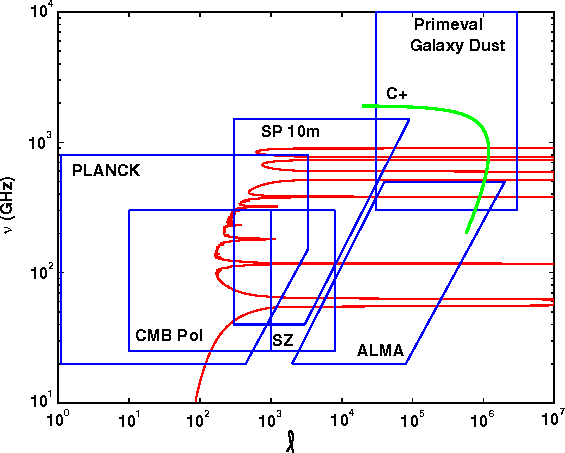
A Comparison of Telescopes for CMB (after
a figure by J. Peterson). Shown in angular scale,
l, vs. observing frequency, n, are science
targets: CMB polarization, Sunyaev-Zel'dovich effect, dust emission by primeval
galaxies, and
the fine structure line of ionized carbon from galaxies. Also shown are the domains of
three instruments: the Planck spacecraft, the SPST, and the
Atacama Large Millimeter
Array (ALMA). The jagged curve [red] is a comparison of atmospheric noise to noise in a
spacecraft environment. On this curve, the South Pole winter atmospheric emission fluctuations
equal the photon fluctuations in a spacecraft environment (assumed to be caused by the brightness
of the sky plus photons emitted from a 1% emissivity 70 K surface). Observations above and to the
left of this curve derive a noise benefit from being in space. Cluster S-Z observations fall to
the right of the noise boundary, and are best done with the SPST.
The NASA Cosmic Microwave Background Future
Missions Working Group recommends that
most CMB polarization observations be done from space,
but high spatial frequency CMB polarization can also be measured with the SPST.
Although they are unresolved, the SPST will
have significant sensitivity to dust emission by primeval galaxies and
high-redshift ionized carbon.