Image List
-
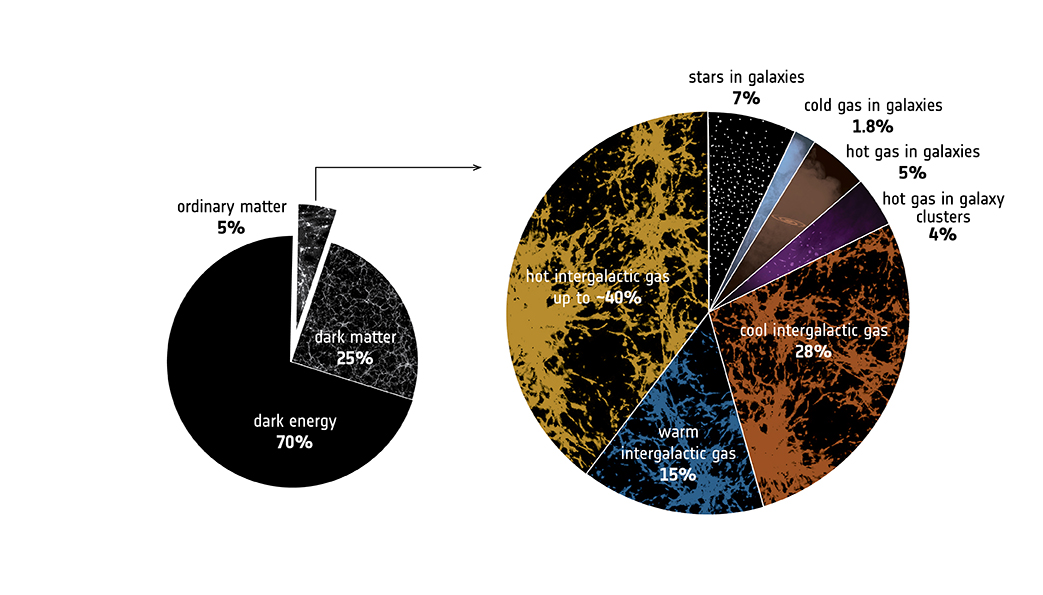
The mysterious dark matter and dark energy make up about 25 and 70 percent of our cosmos respectively, and ordinary matter, which makes up everything we see, including galaxies, stars and planets – amounts to only about five percent. However, stars in galaxies across the Universe only make up about seven percent of all ordinary matter and the cold and hot interstellar gas that permeates galaxies and galaxy clusters together accounts for only about 11 percent. Most of the Universe's ordinary matter, or baryons, lurks in the cosmic web, the filamentary distribution of both dark and ordinary matter that extends throughout the Universe. In the past astronomers were able to locate a good chunk of the cool and warm parts of this intergalactic material (about 43 percent of all baryons in total). Astronomers have now used ESA's XMM-Newton space observatory to detect the hot component of this intergalactic material along the line of sight to a quasar. The amount of hot intergalactic gas detected in these observations amounts up to 40 percent of all baryons in the Universe, closing the gap in the overall budget of ordinary matter in the cosmos.
ESA -
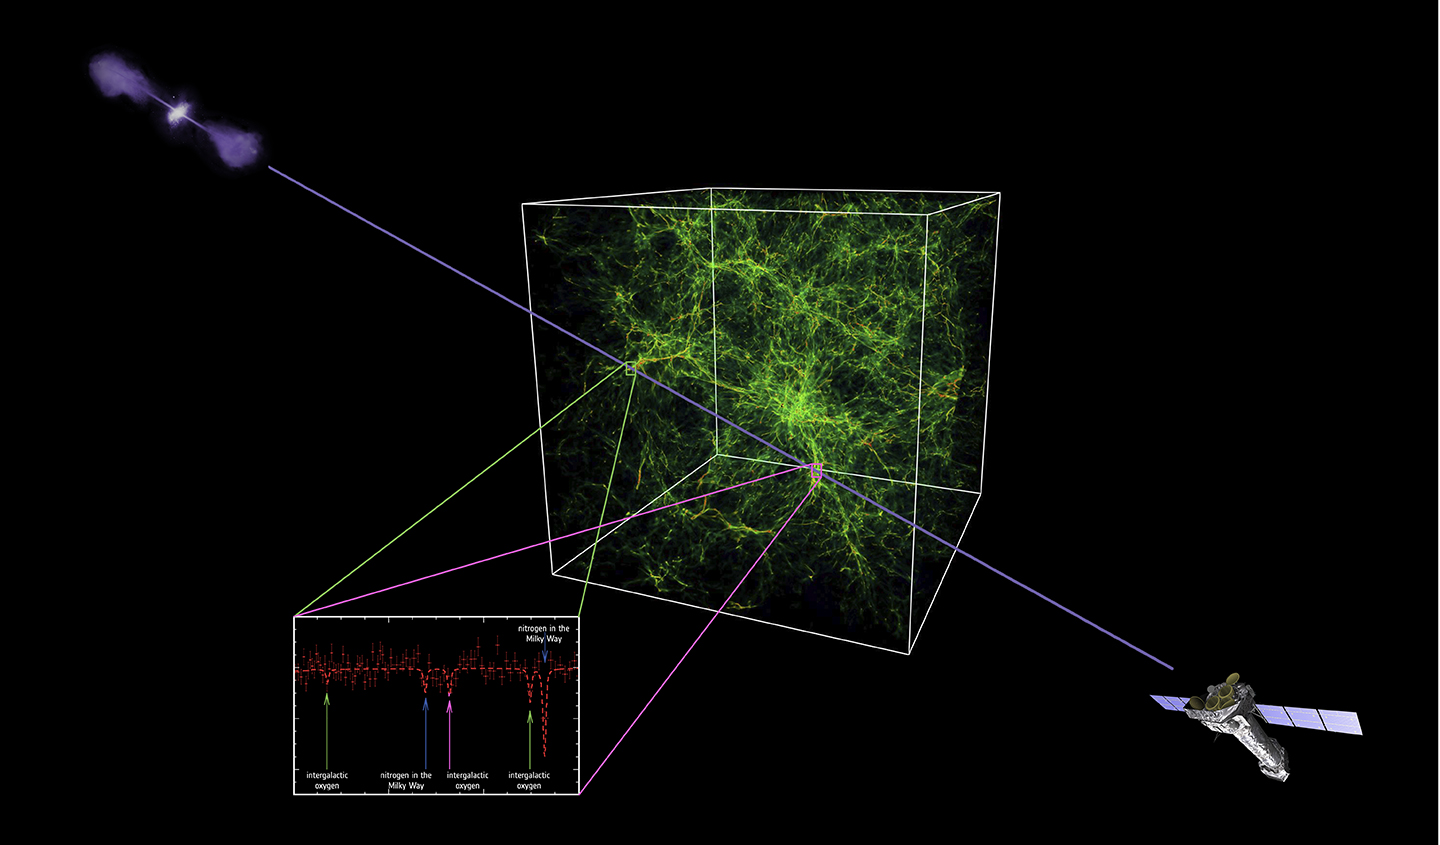
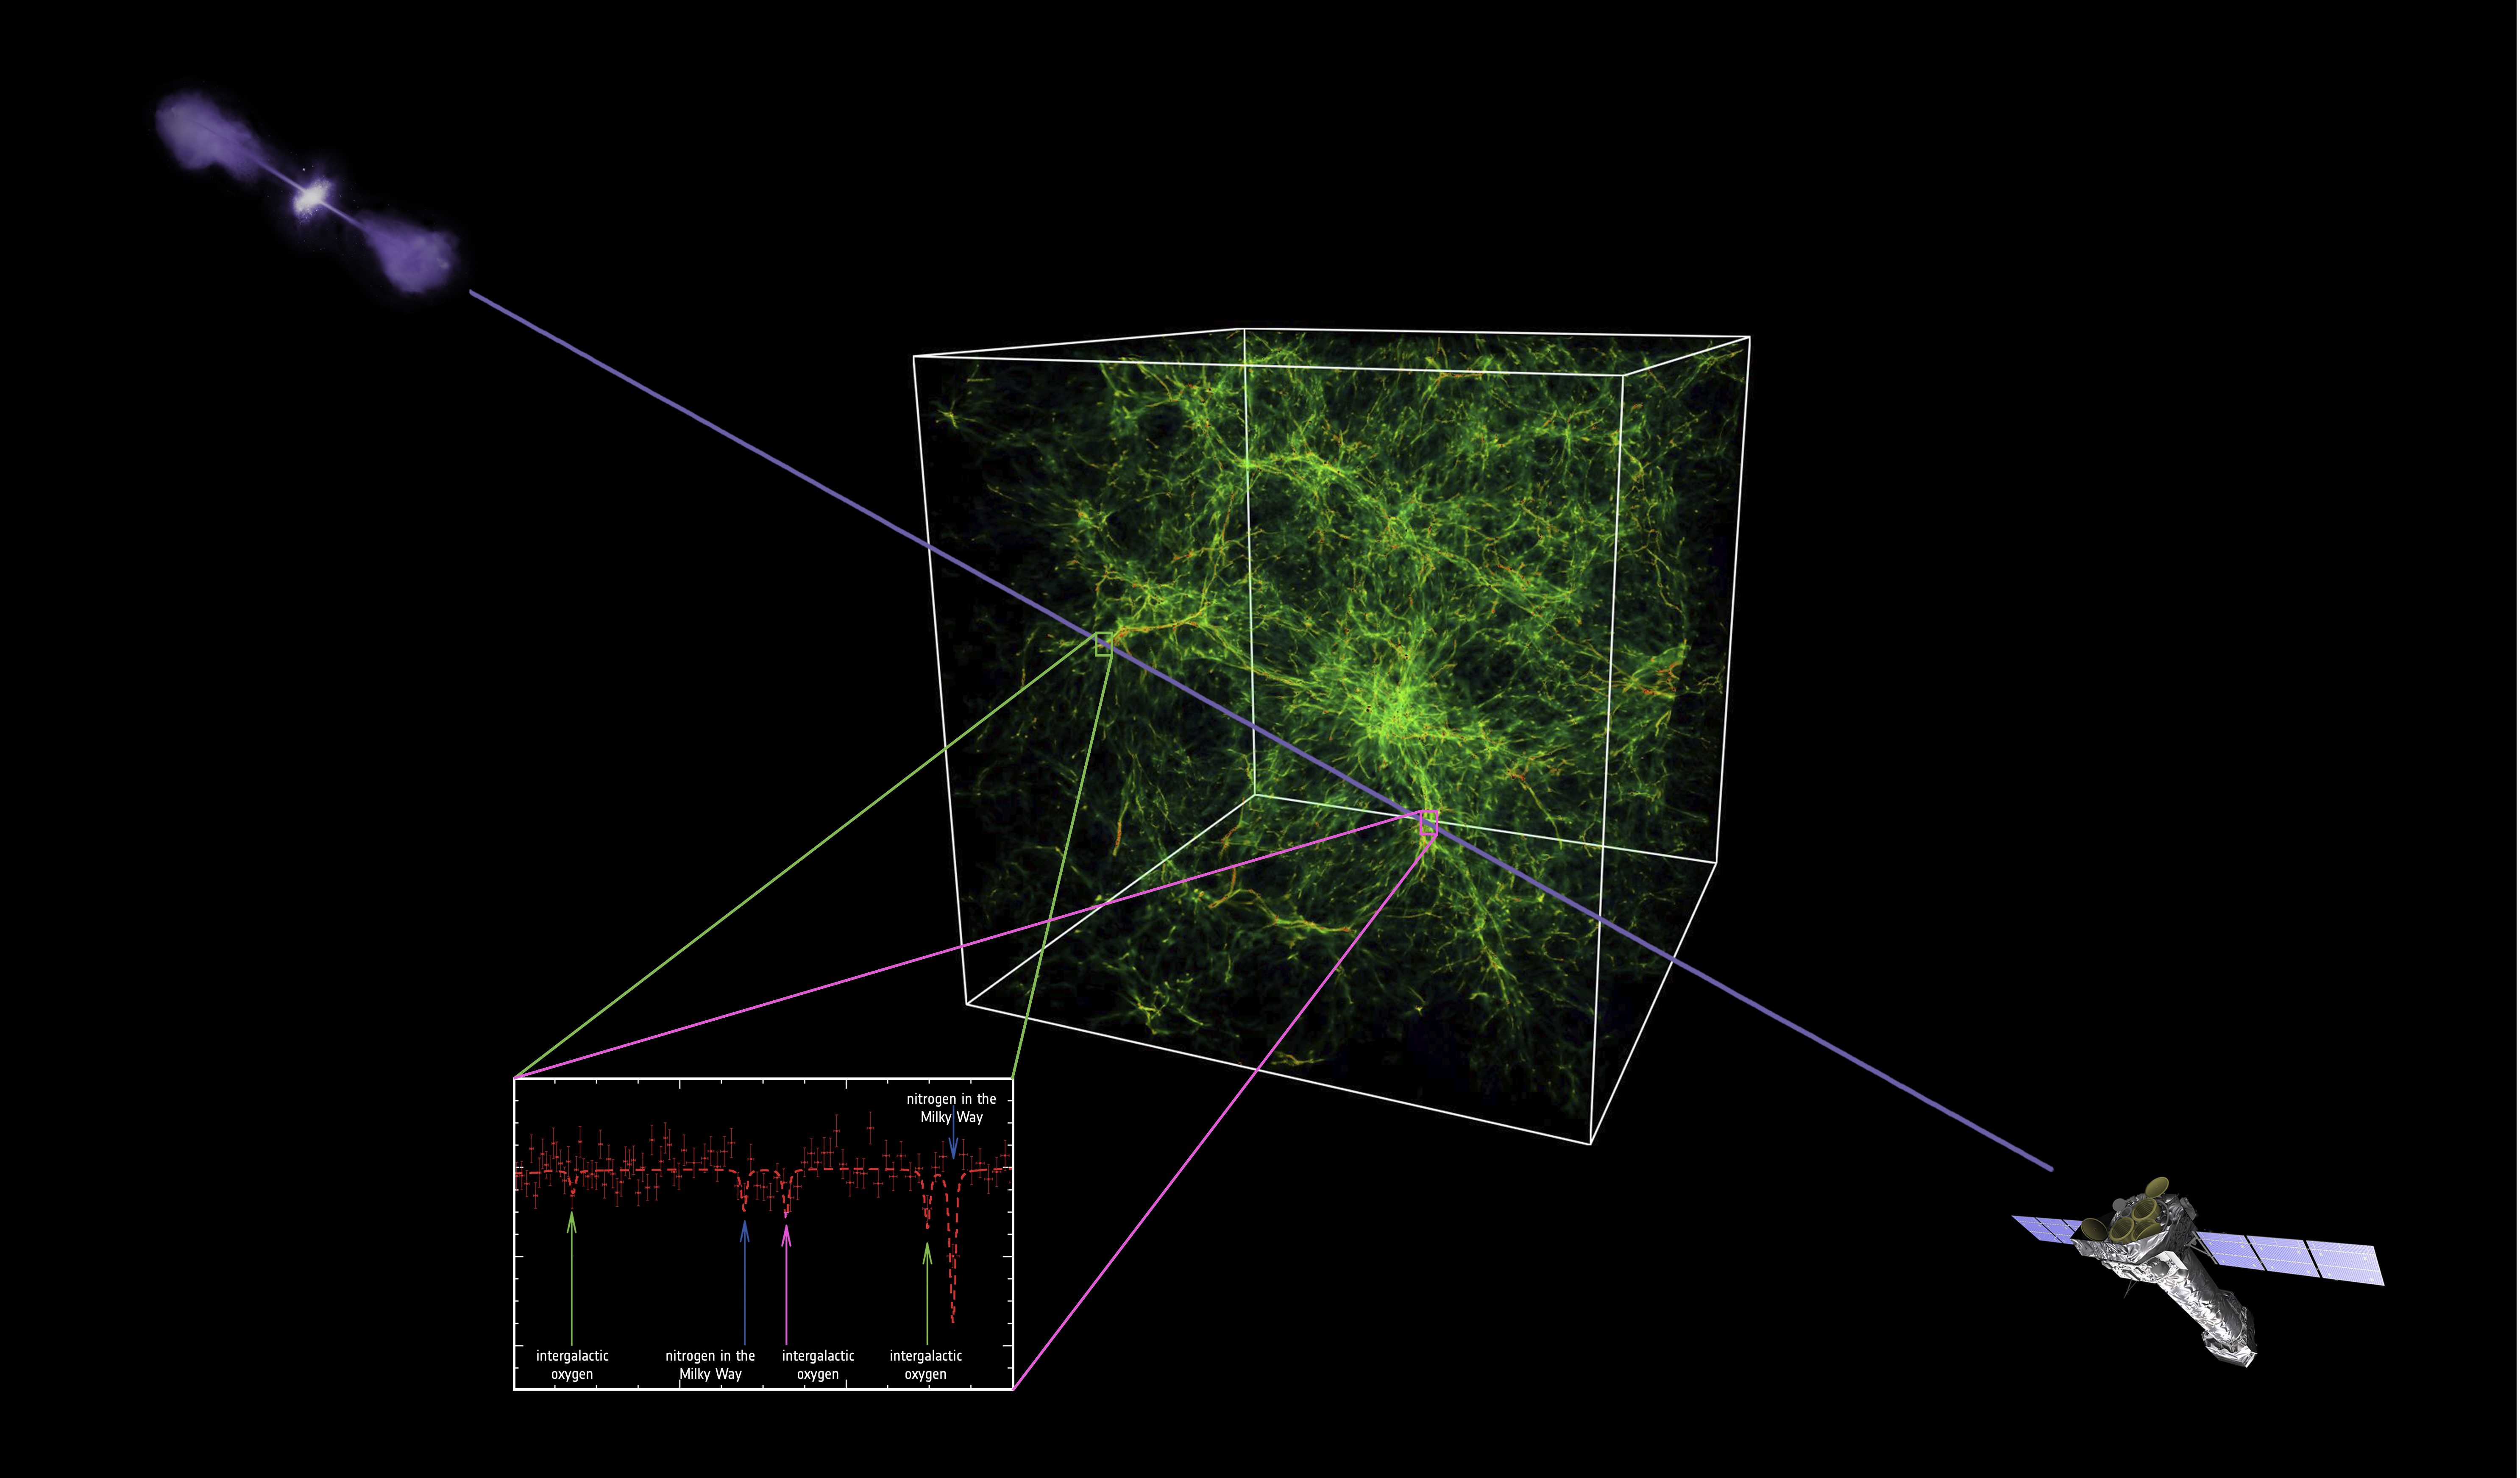
Astronomers have used ESA’s XMM-Newton space observatory (lower right) to detect the WHIM. The white box encloses the filamentary structure of the hot gas that represents part of the WHIM. It is based on a cosmological simulation extending over more than 200 million light years. The red and orange regions have the highest densities & the green regions have lower densities. The discovery was made using observations of a distant quasar – a supermassive black hole that is actively devouring matter and shining brightly from X-rays to radio waves (upper left). The team found the signature of oxygen in the WHIM lying between the observatory and the quasar, at two different locations along the line of sight (shown in the spectrum in the lower left with green and magenta arrows). The blue arrows are signatures of nitrogen in our Milky Way galaxy.
Illustrations and composition: ESA / ATG medialab; data: ESA / XMM-Newton / F. Nicastro et al. 2018; cosmological simulation: Princeton University/Renyue Cen -
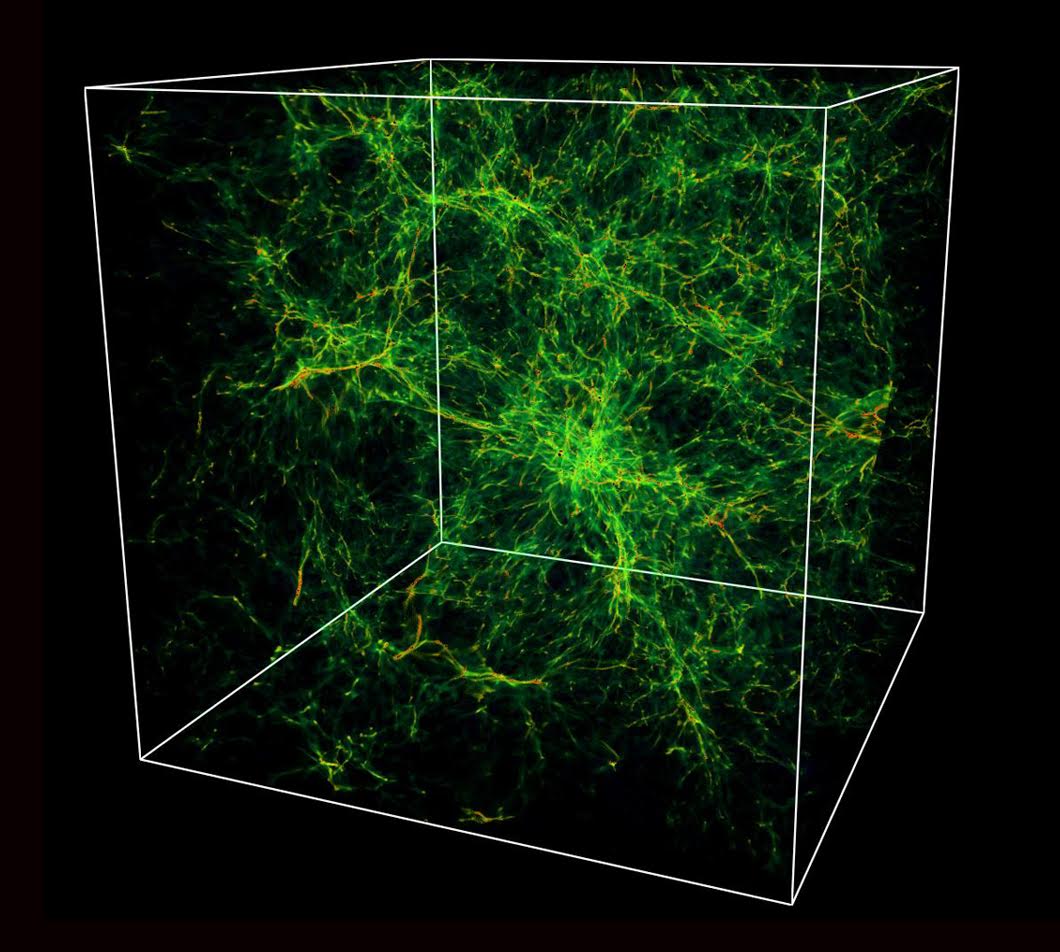
This figure shows the filamentary structure of the hot gas that represents part of the warm-hot intergalactic medium (WHIM). It is based on a simulation extending over more than 200 million light years. The red and orange regions have the highest densities & the green regions have lower densities.
Princeton University/Renyue Cen