Image List
-
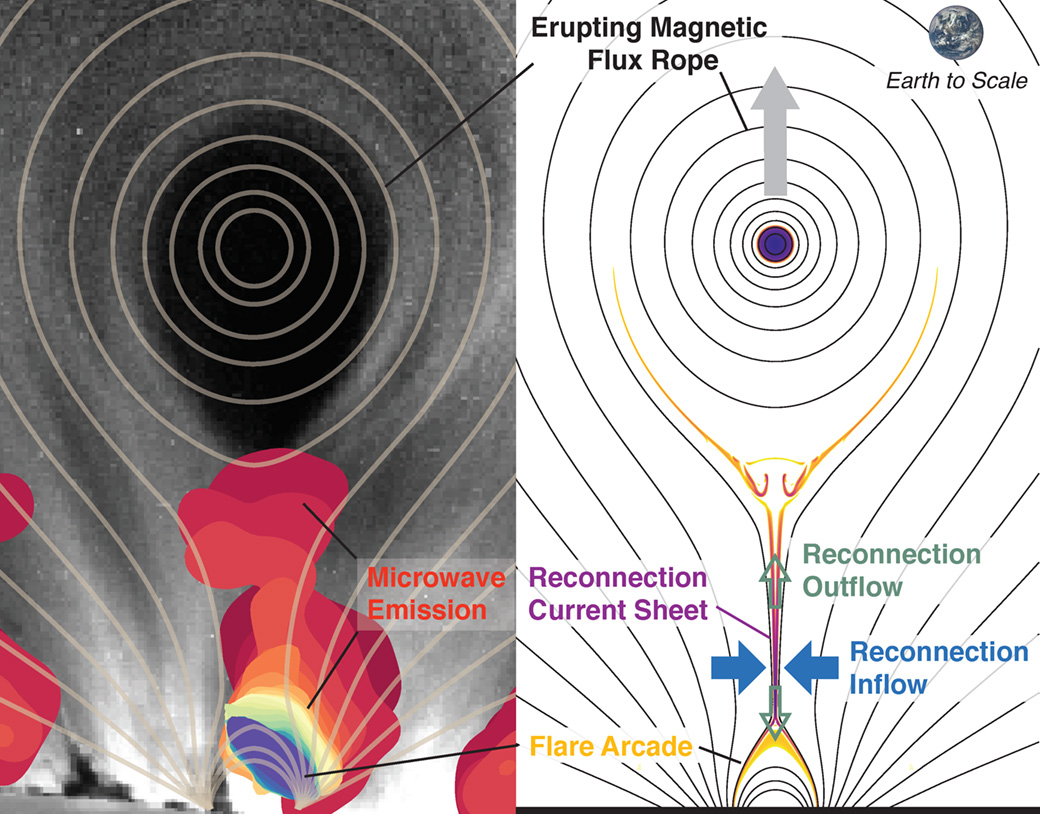
Observations of the Sept. 10, 2017, solar flare and the standard solar flare model. Left: Observations in extreme ultraviolet (grayscale background) and microwave (red to blue indicate increasing frequencies). Light orange curves are selected magnetic field lines from the matching theoretical model. Right: Numerical simulation of the flare. The reconnection current sheet is shown as the thin orange-purple feature located between the erupting magnetic flux rope and the flare arcade. Microwave sources from relativistic electrons are observed to fill the entire region surrounding the current sheet.
NJIT-CSTR, B. Chen, S. Yu; CfA, C. Shen; Solar Dynamics Observatory -
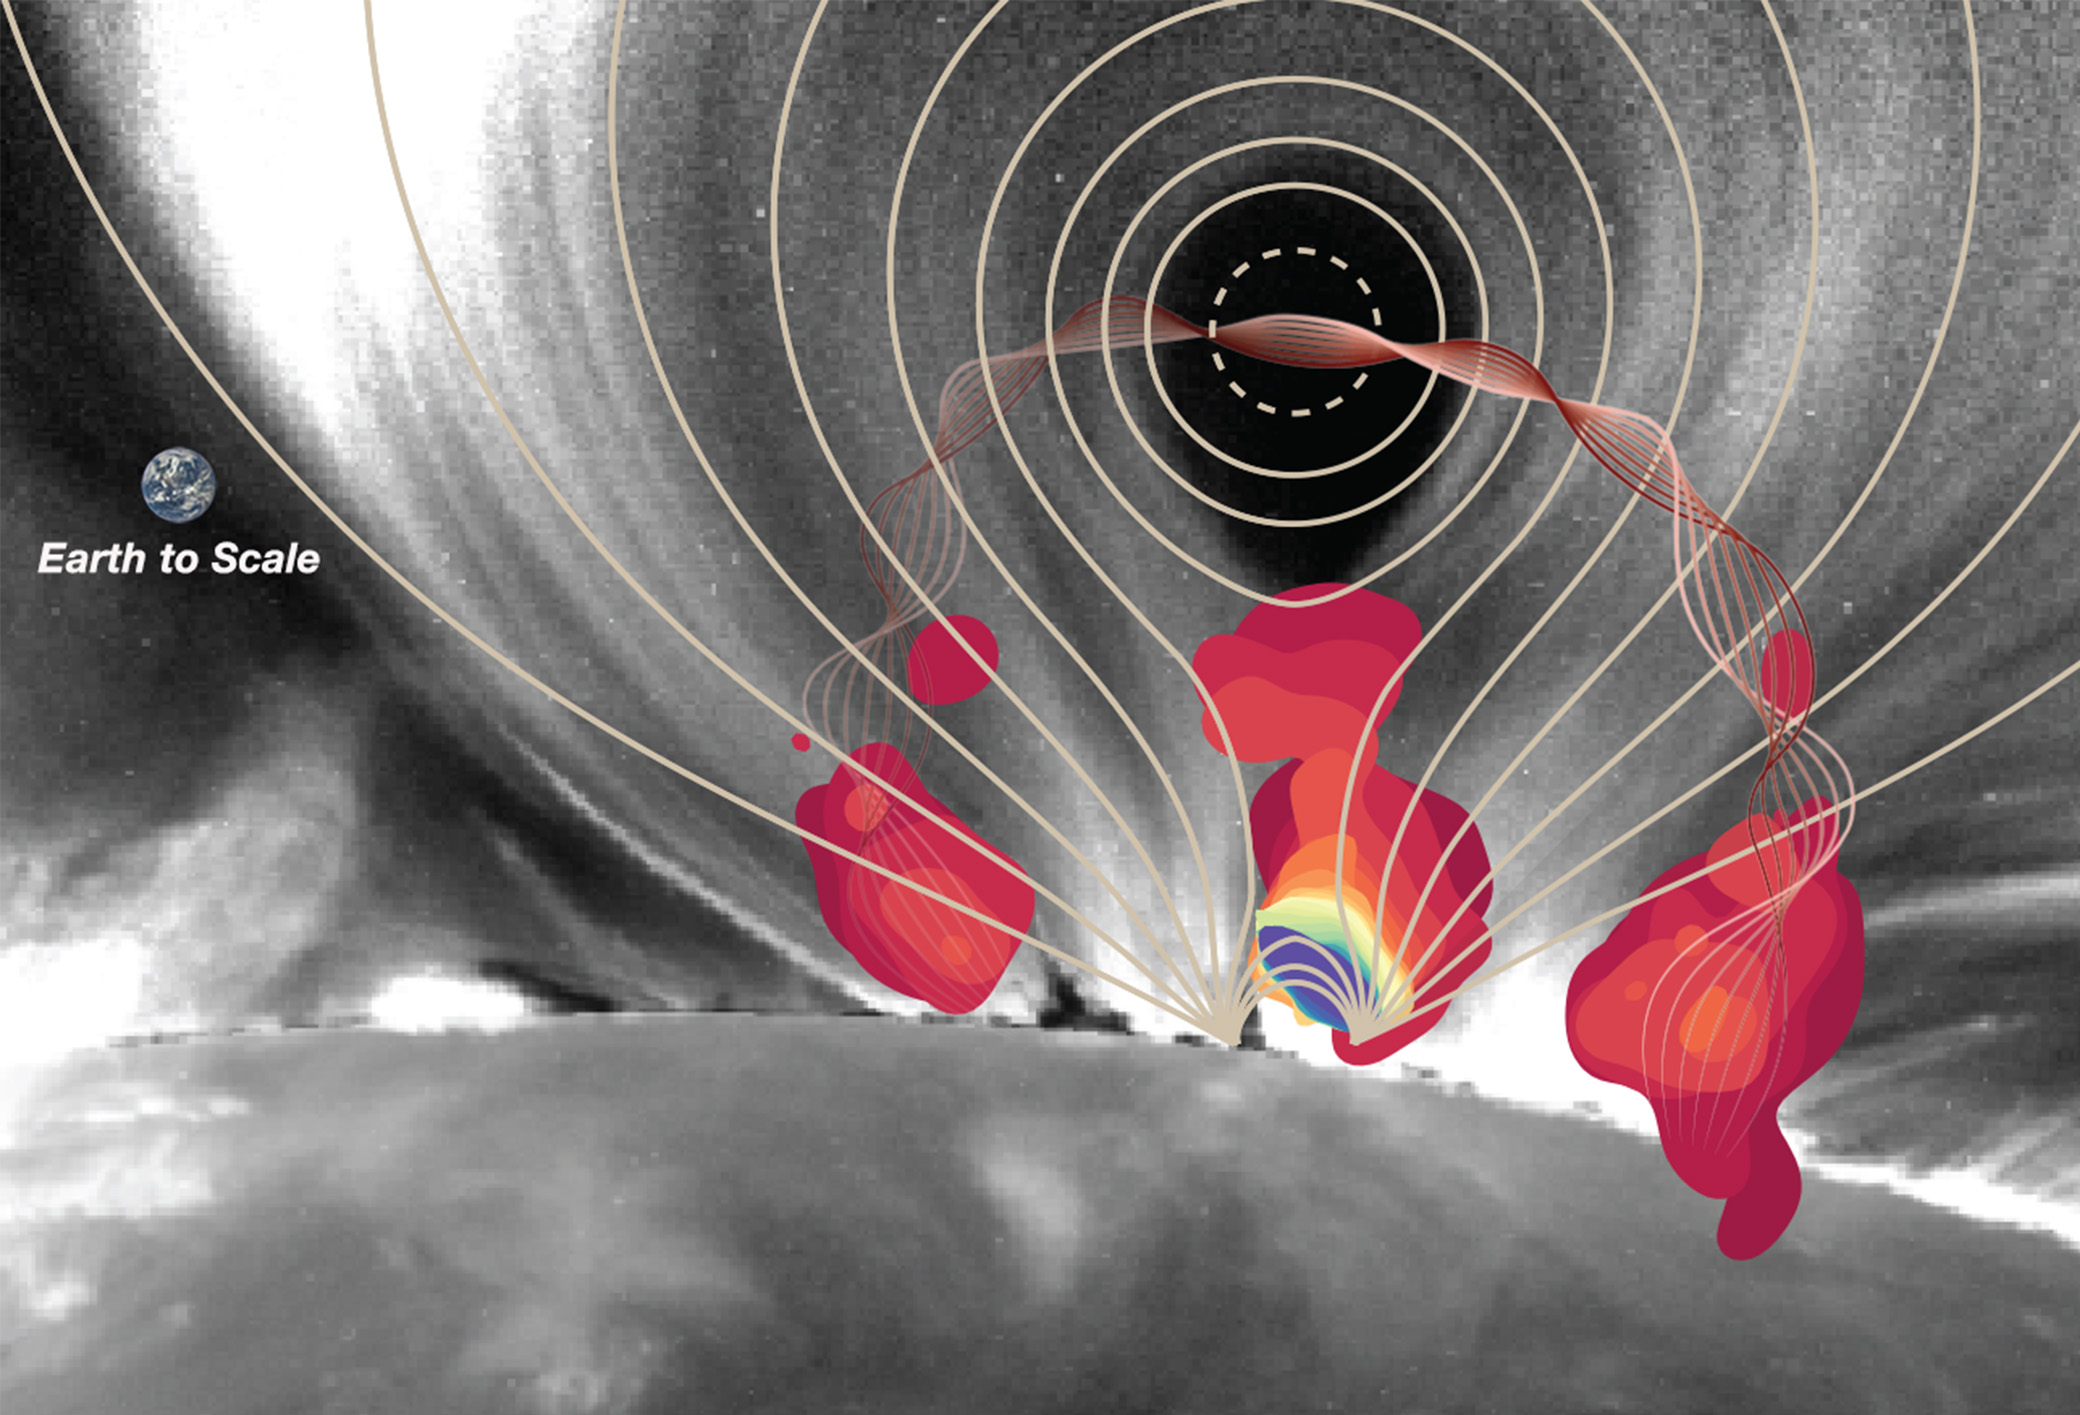
Observation of a large solar flare on Sept. 10, 2017 in extreme ultraviolet (grayscale background, by NASA's Solar Dynamics Observatory) and microwaves (red to blue indicate increasing frequencies, observed by the Expanded Owens Valley Solar Array). Light orange curves are selected magnetic field lines from the matching theoretical solar eruptive flare model. The flare is driven by the eruption of a twisted magnetic flux rope (illustrated by a bundle of color curves threading the dark cavity). Microwave sources are observed throughout the region below the cavity where a large-scale reconnection current sheet — the flare's "central engine" — is located, providing crucial measurements for its physical properties.
NJIT-CSTR, B. Chen, S. Yu; NASA Solar Dynamics Observatory